Ethereum’s ether traded below the 8 and 0 support levels against the US Dollar. ETH price is now testing 2 and it remains at a risk of more downsides.
- Ethereum extended its decline below the 2 and 8 support levels.
- The price is now trading well below 0 and the 100 hourly simple moving average.
- There was a break below a major bullish trend line with support near 1 on the hourly chart of ETH/USD (data feed via Kraken).
- The pair is now testing a crucial breakdown support near the 2-3 zone.
Ethereum Price is Recovering
After topping near the 4 level, Ethereum started a fresh decline. ETH price broke the 2 and 8 support levels to move into a short-term bearish zone.
More importantly, there was a break below a major bullish trend line with support near 1 on the hourly chart of ETH/USD. It opened the doors for more losses below the 0 support and the 100 hourly simple moving average. Similarly, there was a fresh decline in bitcoin price below the ,500 support zone.
Ether price even declined below the 76.4% Fib retracement level of the upward move from the 3 swing low to 4 swing high. It is now trading near a crucial breakdown support near the 2-3 zone.
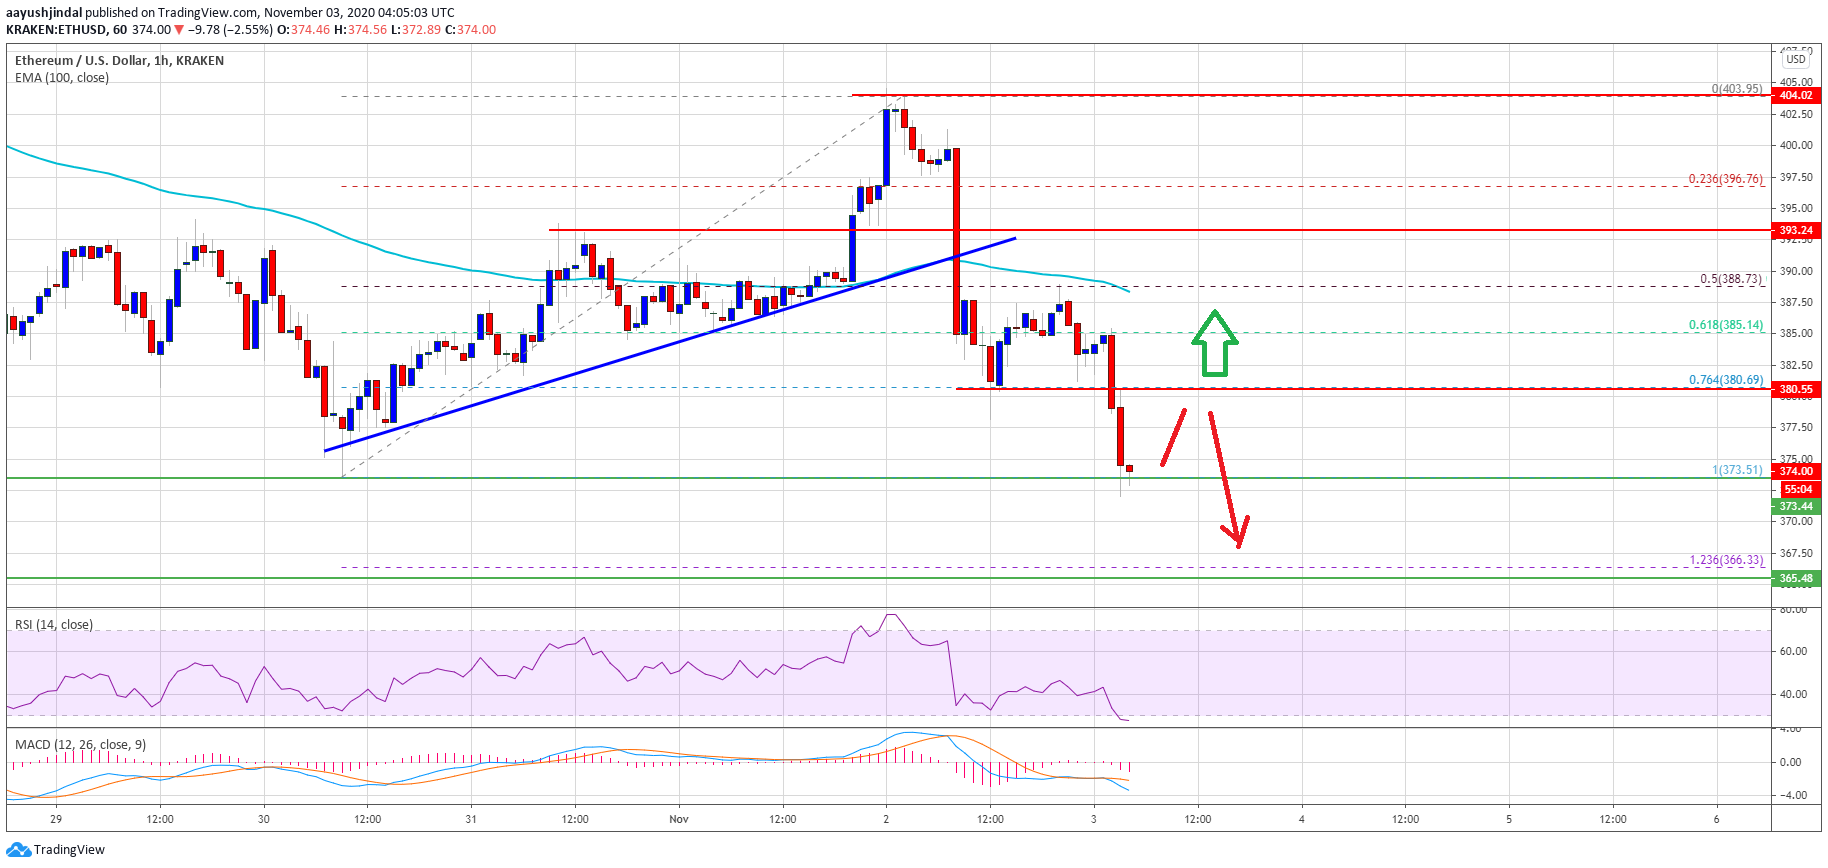
Source: ETHUSD on TradingView.com
If there is a downside break below the 2-3 support zone, the price could continue to move down towards the 6 and 5 support levels. The 1.236 Fib extension level of the upward move from the 3 swing low to 4 swing high is also near the 6 level.
Any further losses below the 6 and 5 support levels may perhaps clear the path for an extended decline towards the 5 support in the coming sessions. The next major support is near the 0 level.
Upsides Capped in ETH?
If Ethereum starts an upside correction, the previous support near the 0 level is likely to act as a hurdle for the bulls. The next major resistance is near the 5 level.
The main resistance for the bulls is forming near the 8 level and the 100 hourly simple moving average, above which ether price could test or even break the 0 resistance zone.
Technical Indicators
Hourly MACD – The MACD for ETH/USD is slowly losing momentum in the bullish zone.
Hourly RSI – The RSI for ETH/USD is still well above the 60 level.
Major Support Level – 2
Major Resistance Level – 2