Ethereum is up over 2% and it broke the main 0 resistance against the US Dollar. ETH price is likely to accelerate higher once it clears the 8 resistance zone.
- ETH price is back in a positive zone above the 0 and 2 resistance levels against the US Dollar.
- There is a strong support forming near 5 and the 100 simple moving average (4-hours).
- There was a break above a crucial bearish trend line with resistance near 5 on the 4-hours chart of ETH/USD (data feed via Kraken).
- The pair is likely to continue higher once it clears the 8 resistance level in the near term.
Ethereum Price Turns Green
After a strong downside correction, Ethereum found support near the 0 level against the US Dollar. ETH price made two attempts to decline below the 0 support, but the bears failed to gain momentum.
As a result, ether started a strong increase and broke the 5 resistance. It opened the doors for more gains above the 5 pivot and resistance level. The price climbed above the 50% Fib retracement level of the downward move from the 1 high to 0 low.
More importantly, there was a break above a crucial bearish trend line with resistance near 5 on the 4-hours chart of ETH/USD. The pair is now trading nicely above the 0 resistance level, the 100 simple moving average (4-hours), and the 76.4% Fib retracement level of the downward move from the 1 high to 0 low.
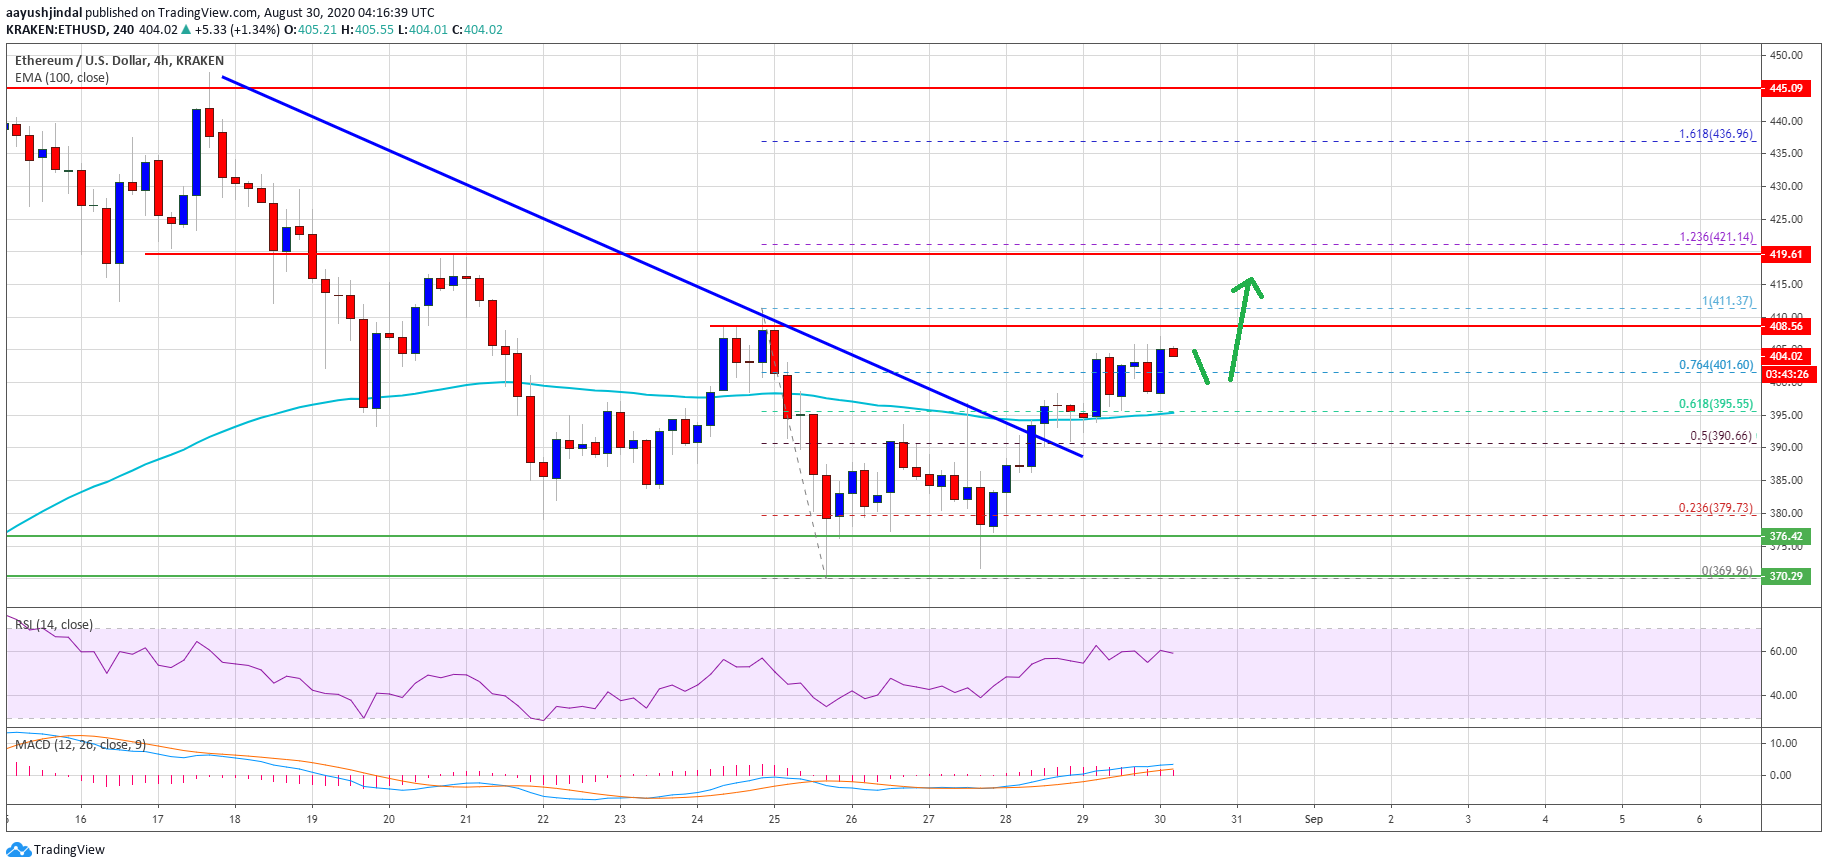
Ethereum price trades above 0. Source: TradingView.com
An immediate resistance is near the 8 level (the last key breakdown zone). A successful close above the 8 level may perhaps open the doors for a larger increase in the near term.
The next major resistance for ether could be near the 0 level or the 1.236 Fib extension level of the downward move from the 1 high to 0 low. Any further gains could lead the price towards the 0 resistance.
Downsides Limited in Ether (ETH)?
If Ethereum fails to clear the 8 resistance zone, it might start a downside correction. An initial support is near the 5 level and the 100 simple moving average (4-hours).
The next major support is near the 0 level, below which the bears are likely to target a retest of the 0 support region in the near term.
Technical Indicators
4 hours MACD – The MACD for ETH/USD is slowly moving in the bullish zone.
4 hours RSI – The RSI for ETH/USD is now well above the 50 level.
Major Support Level – 5
Major Resistance Level – 8