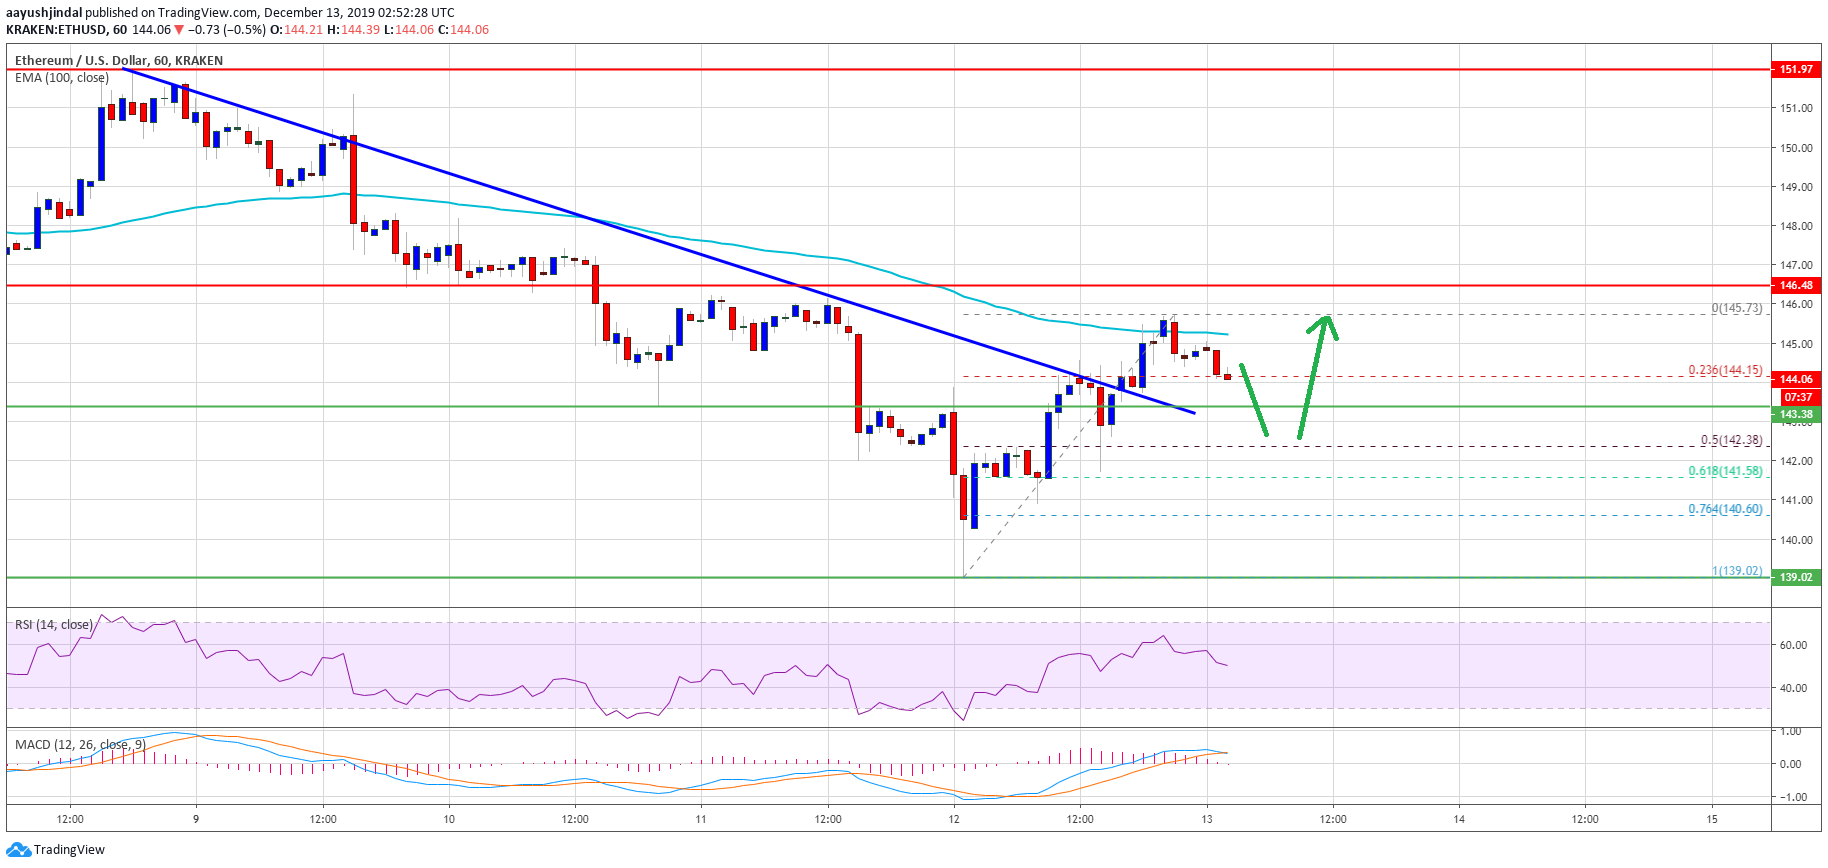
- Ethereum is slowly recovering from the 0 support area against the US Dollar.
- The price is currently facing resistance near the 5 level and the 100 hourly SMA.
- There was a break above this week’s key bearish trend line with resistance near 4 on the hourly chart of ETH/USD (data feed via Kraken).
- The price might make another attempt to surpass the 5 and 6 hurdles in the near term.
Ethereum price is showing a few recovery signs versus the US Dollar, while bitcoin is consolidating. ETH price must surpass 8 to move into a positive zone.
Ethereum Price Analysis
Recently, we saw a downside extension in Ethereum below the 4 support area against the US Dollar. Moreover, ETH price broke the 2 support area and the 100 hourly simple moving average.
Finally, it spiked below the 0 support and formed a new monthly low near 9. It is currently correcting higher and it surpassed the 2 resistance area to start a decent recovery.
Besides, there was a break above this week’s key bearish trend line with resistance near 4 on the hourly chart of ETH/USD. The pair is now trading near the 5 resistance and struggling to clear the 100 hourly simple moving average.
The recent high is near 5 and the pair is testing the 23.6% Fib retracement level of the recent recovery from the 9 low to 5 high. If there are additional losses, Ethereum price might correct towards the 2 support area.
Additionally, the 50% Fib retracement level of the recent recovery from the 9 low to 5 high is near the 2 level. Any further losses might push the price below 0 and the bulls are likely to struggle.
On the upside, the bulls need to gain strength above the 5 and 6 resistance levels. More importantly, a close above the 8 resistance and the 100 hourly SMA is needed for a sustained recovery.
The main resistance is still near the 2 area, above which the price is likely to start a solid uptrend in the coming days. If not, it could resume its slide below 0.
Ethereum Price
Looking at the chart, Ethereum price is showing a few recovery signs above the 0 level. Having said that, the price is struggling to continue to above the 5 and 6 resistance levels, above which it could retest the 2 resistance.
ETH Technical Indicators
Hourly MACD – The MACD for ETH/USD is slowly moving back into the bearish zone.
Hourly RSI – The RSI for ETH/USD is currently correcting lower towards the 50 level.
Major Support Level – 0
Major Resistance Level – 6
The post Ethereum (ETH) Recovery Facing Hurdles, Bitcoin Consolidating appeared first on NewsBTC.