- Ethereum price failed to continue above 0 and declined below 8 against the US Dollar.
- The price is currently correcting higher, but it is likely to face resistance near 7-8.
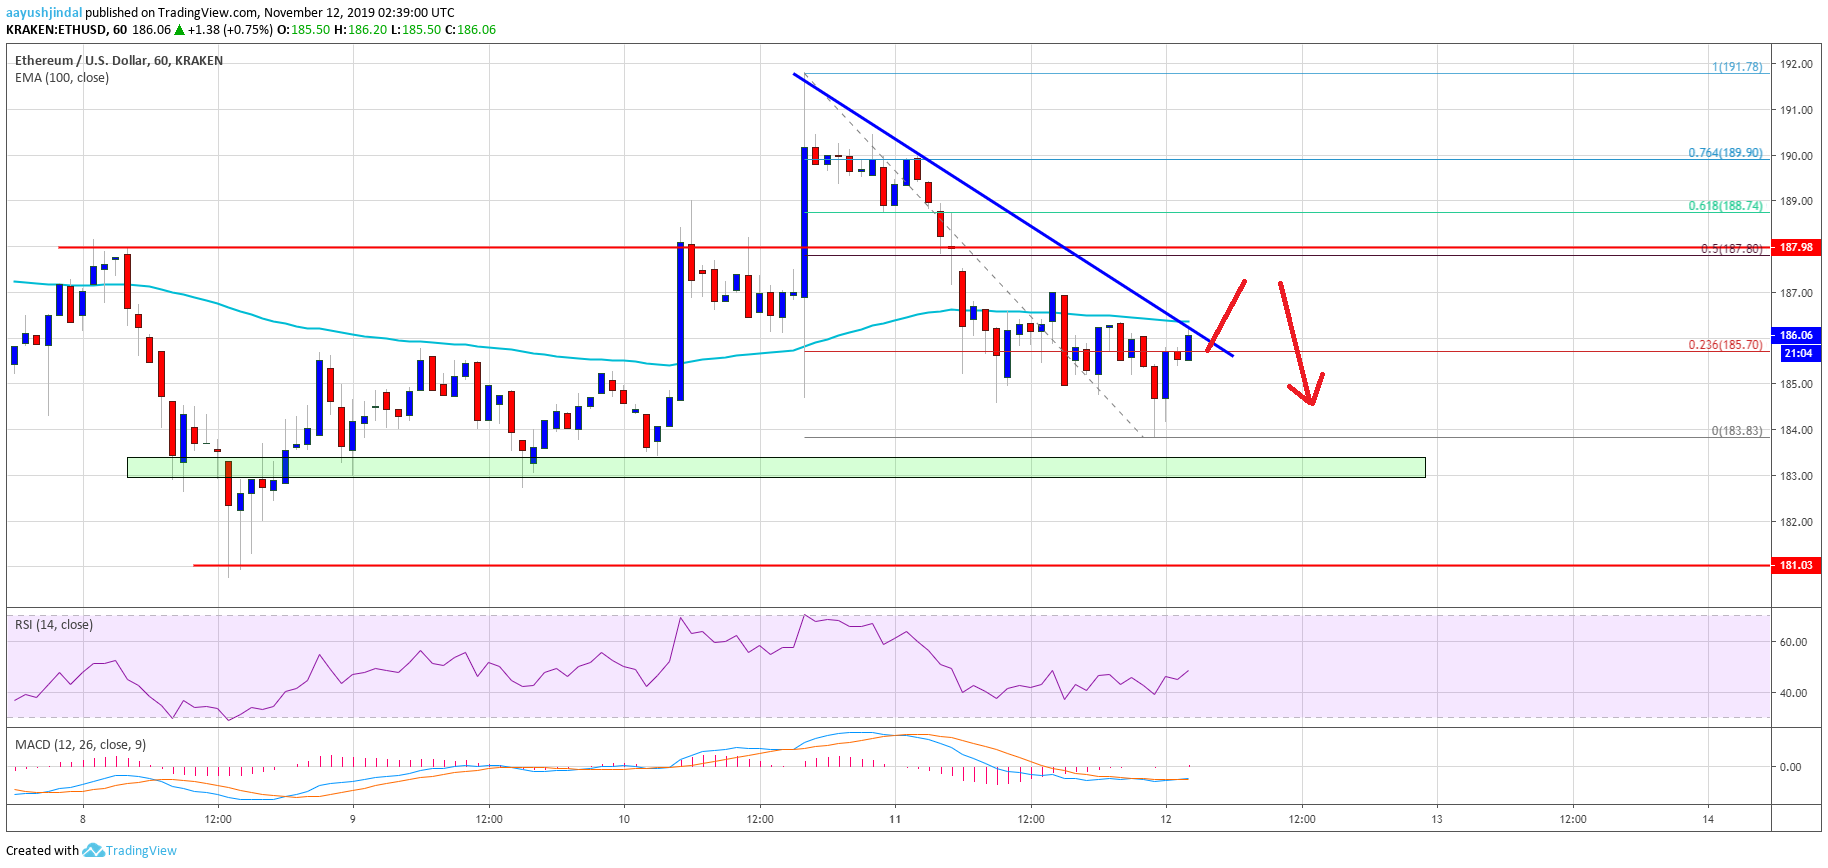
- There is a connecting bearish trend line forming with resistance near 7 on the hourly chart of ETH/USD (data feed via Kraken).
- Bitcoin is trading with a bearish angle below the ,950 and ,000 resistance levels.
Ethereum price is trading in a broad range versus the US Dollar, while bitcoin is struggling. ETH price might revisit the 2 range support area in the near term.
Ethereum Price Analysis
Yesterday, there was a decent increase in Ethereum above the 8 resistance against the US Dollar. ETH even surpassed the 0 resistance area and the 100 hourly simple moving average.
However, the price struggled to gain strength above 0 and formed a high near the 2 level. Later, there was a downward move below the 8 support area and the 100 hourly simple moving average.
Moreover, the price traded below the 50% Fib retracement level of the upward move from the 0 swing low to 2 high. The bulls even failed to defend the 5 support and the price tested the 3 area.
Ethereum is currently correcting higher and trading near the 6 level. Additionally, it is trading near the 23.6% Fib retracement level of the recent decline from the 2 high to 4 swing low.
On the upside, an immediate resistance is near the 7 level. More importantly, there is a connecting bearish trend line forming with resistance near 7 on the hourly chart of ETH/USD, coinciding with the 100 hourly SMA.
If there is an upside break above the trend line and the 100 hourly SMA, the price could test the 8 resistance area. Any further gains may perhaps push the price towards the 2 swing high in the near term.
Conversely, the price could decline further if it fails to clear the 8 resistance. An immediate support is near the 4 level. The main supports are near the 2 and 0 levels, below which the bears are likely to gain strength.
Ethereum Price
Looking at the chart, Ethereum price seems to be trading in a broad range between 0 and 0. A successful close on the either side could trigger the next move. As long as there is no daily close below 0, there are chances of a fresh increase towards 0 and 5.
ETH Technical Indicators
Hourly MACD – The MACD for ETH/USD is about to move into the bullish zone.
Hourly RSI – The RSI for ETH/USD is currently rising and it is likely to clear the 50 level.
Major Support Level – 2
Major Resistance Level – 8
The post Ethereum (ETH) Stuck In Range While Bitcoin Is Sliding appeared first on NewsBTC.