- Ethereum price is currently correcting losses after it traded as low as $3 against the US Dollar.
- Bitcoin price is struggling to recover above the ,500 and ,600 resistance levels.
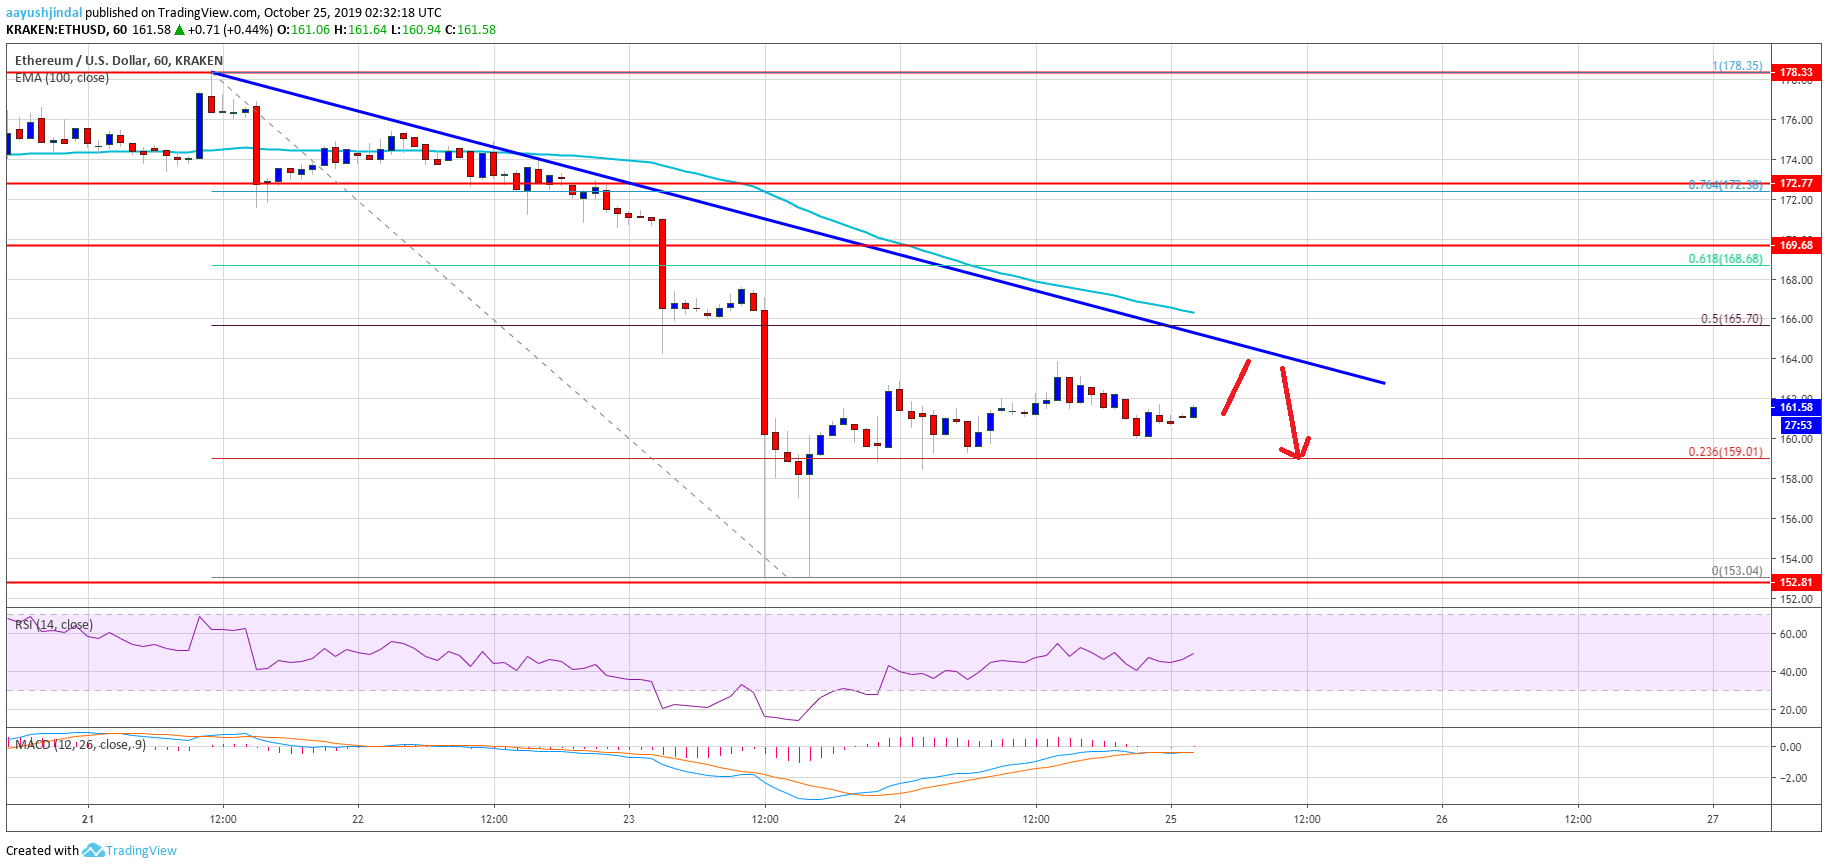
- This week’s followed bearish trend line is still active with resistance near 4 on the hourly chart of ETH/USD (data feed via Kraken).
- The pair is likely to face a strong resistance near the 4 and 5 levels in the near term.
Ethereum price is slowly rebounding versus the US Dollar, while bitcoin is still struggling. ETH price must climb above 5 to extend its recovery to 0.
Ethereum Price Analysis
Yesterday, we saw a massive decline in Ethereum below the 0 and 5 support levels against the US Dollar. Moreover, ETH price settled below the 5 support and the 100 hourly simple moving average.
It opened the doors for more losses and the price traded below the 0 support. Finally, there was a spike below 5 and the price traded as low as 3. Recently, it started an upside correction above the 5 and 8 levels.
Additionally, there was a break above the 23.6% Fib retracement level of the downward move from the 8 high to 3 low. Ethereum is currently consolidating above 0, but it is facing a lot of hurdles on the upside near the 4 and 5 levels.
More importantly, this week’s followed bearish trend line is still active with resistance near 4 on the hourly chart of ETH/USD. The trend line coincides with the 50% Fib retracement level of the downward move from the 8 high to 3 low.
Besides, the 100 hourly SMA is also positioned near the 5 level. Therefore, an upside break above the 5 resistance is needed for a recovery towards the 0 and 2 resistance levels.
If the price fails to recover above the 4 and 5 resistance levels, it could resume its decline. An immediate support is near the 8 level, below which the price could revisit the 3 low. Any further losses might call for a break below the 0 support area.
Ethereum Price
Looking at the chart, Ethereum price is clearly facing a lot of barriers on the upside near 4 and 5. In the short term, the price could make an attempt to surpass 5 and the 100 hourly SMA. However, it is likely to fail near 5 and likely to resume its decline in the coming sessions.
ETH Technical Indicators
Hourly MACD – The MACD for ETH/USD is slowly moving back into the bearish zone.
Hourly RSI – The RSI for ETH/USD is correcting higher and is approaching the key 50 level.
Major Support Level – 3
Major Resistance Level – 5
The post Ethereum (ETH) Rebound Approaching Crucial Resistance appeared first on NewsBTC.