- Ethereum price is currently correcting higher, but it is facing a strong resistance near 0 against the US Dollar.
- Bitcoin price is up more than 1.5%, but it is also facing resistance ,120 and ,200.
- This week’s followed major bearish trend line was breached with resistance near 4 on the hourly chart of ETH/USD (data feed via Kraken).
- The pair is clearly facing a strong resistance near the 0 level and the 100 hourly SMA.
Ethereum price is currently recovering higher versus the US Dollar, similar to bitcoin. However, ETH price must settle above 0 to continue higher in the near term.
Ethereum Price Analysis
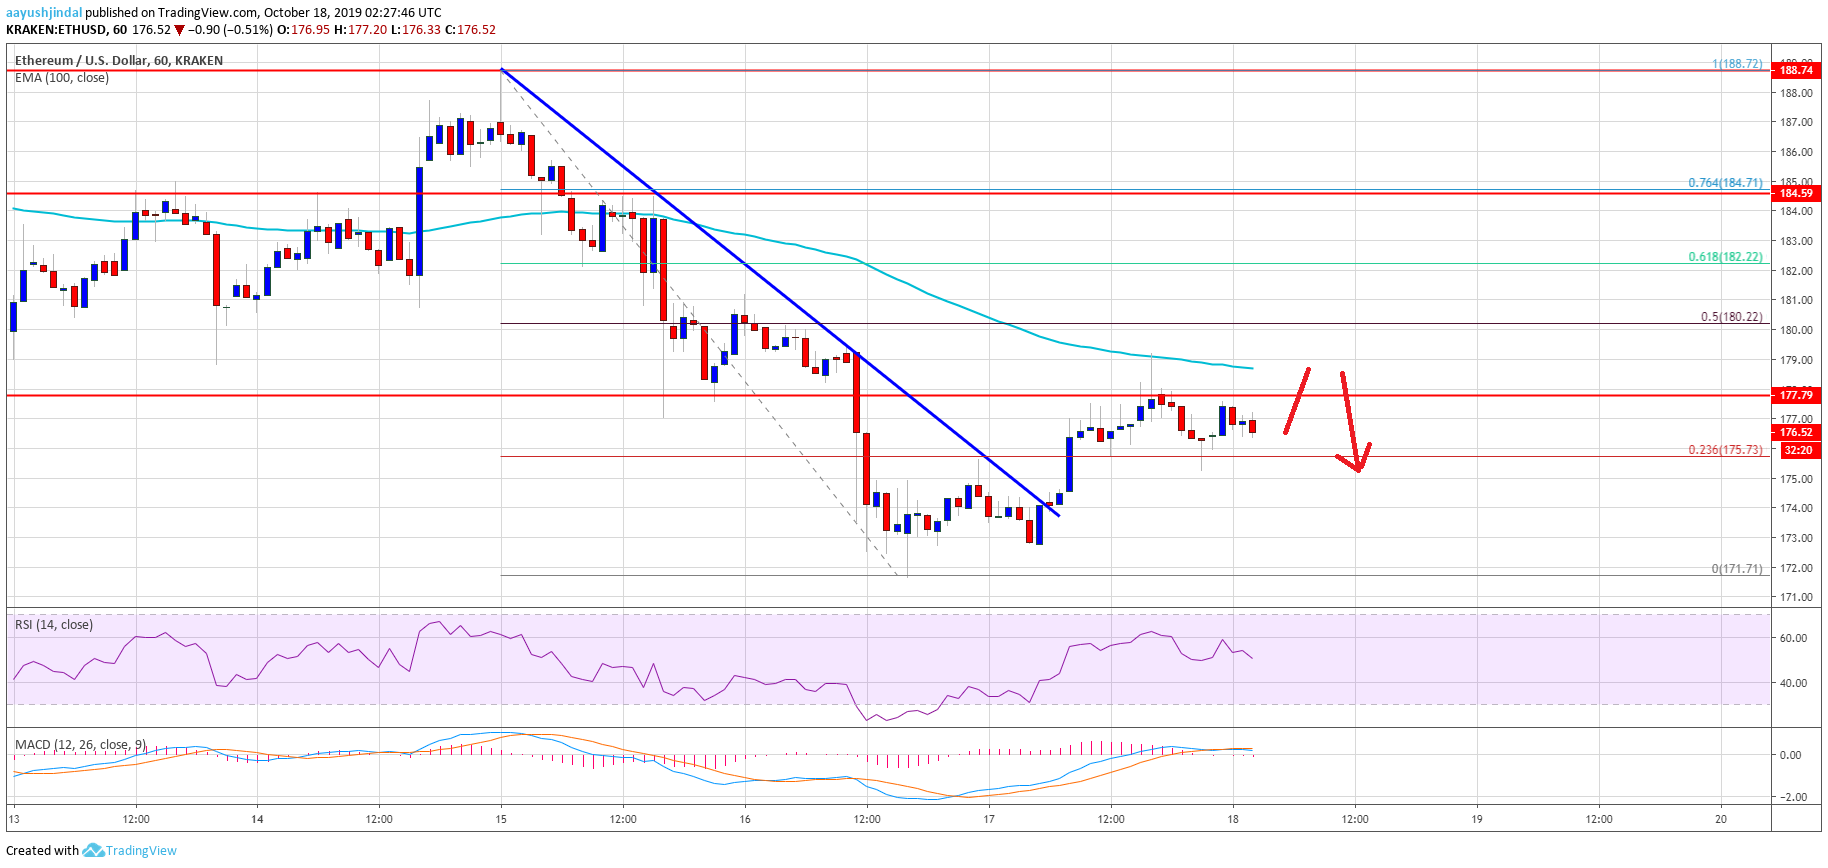
Yesterday, we saw an extended decline in Ethereum below the 0 support against the US Dollar. Moreover, ETH price settled below the 0 support and the 100 hourly simple moving average. The decline was such that the price traded close to the 0 level. A swing low was formed near 1 before the price started an upside correction. It recovered above the 4 and 5 resistances.
Additionally, this week’s followed major bearish trend line was breached with resistance near 4 on the hourly chart of ETH/USD. The pair climbed above the 23.6% Fib retracement level of the last decline from the 8 high to 1 low. Finally, the price spiked above the 8 resistance area. However, the upward move is facing hurdle near the 0 resistance and the 100 hourly simple moving average.
Moreover, the price failed to test the 50% Fib retracement level of the last decline from the 8 high to 1 low. Ethereum retreated from highs and it is currently trading below 8. It seems like the 0 area and the 100 hourly SMA are crucial barriers. Therefore, a successful close above 0 could push the bulls to continue higher in the near term.
If not, there is a risk of another decline below the 5 level. The main support is near the 2 and 0 levels. If there are more downsides, the price is likely to accelerate its decline below the 5 level. The next key support is near the 0 level.
Looking at the chart, Ethereum price is facing a strong resistance near the 0 level and the 100 hourly SMA. If there is a successful close above 0, the price could recover towards the 5 level. An intermediate resistance is near the 61.8% Fib retracement level of the last decline from the 8 high to 1 low.
ETH Technical Indicators
Hourly MACD – The MACD for ETH/USD is likely to move into the bearish zone.
Hourly RSI – The RSI for ETH/USD is currently moving lower towards the 50 level.
Major Support Level – 0
Major Resistance Level – 0
The post Ethereum (ETH) Rebound Faces Major Hurdle Near 0 appeared first on NewsBTC.