- Ethereum price extended its decline and broke the 5 support area against the US Dollar.
- Bitcoin price is also down more than 3% and it broke the ,000 support area.
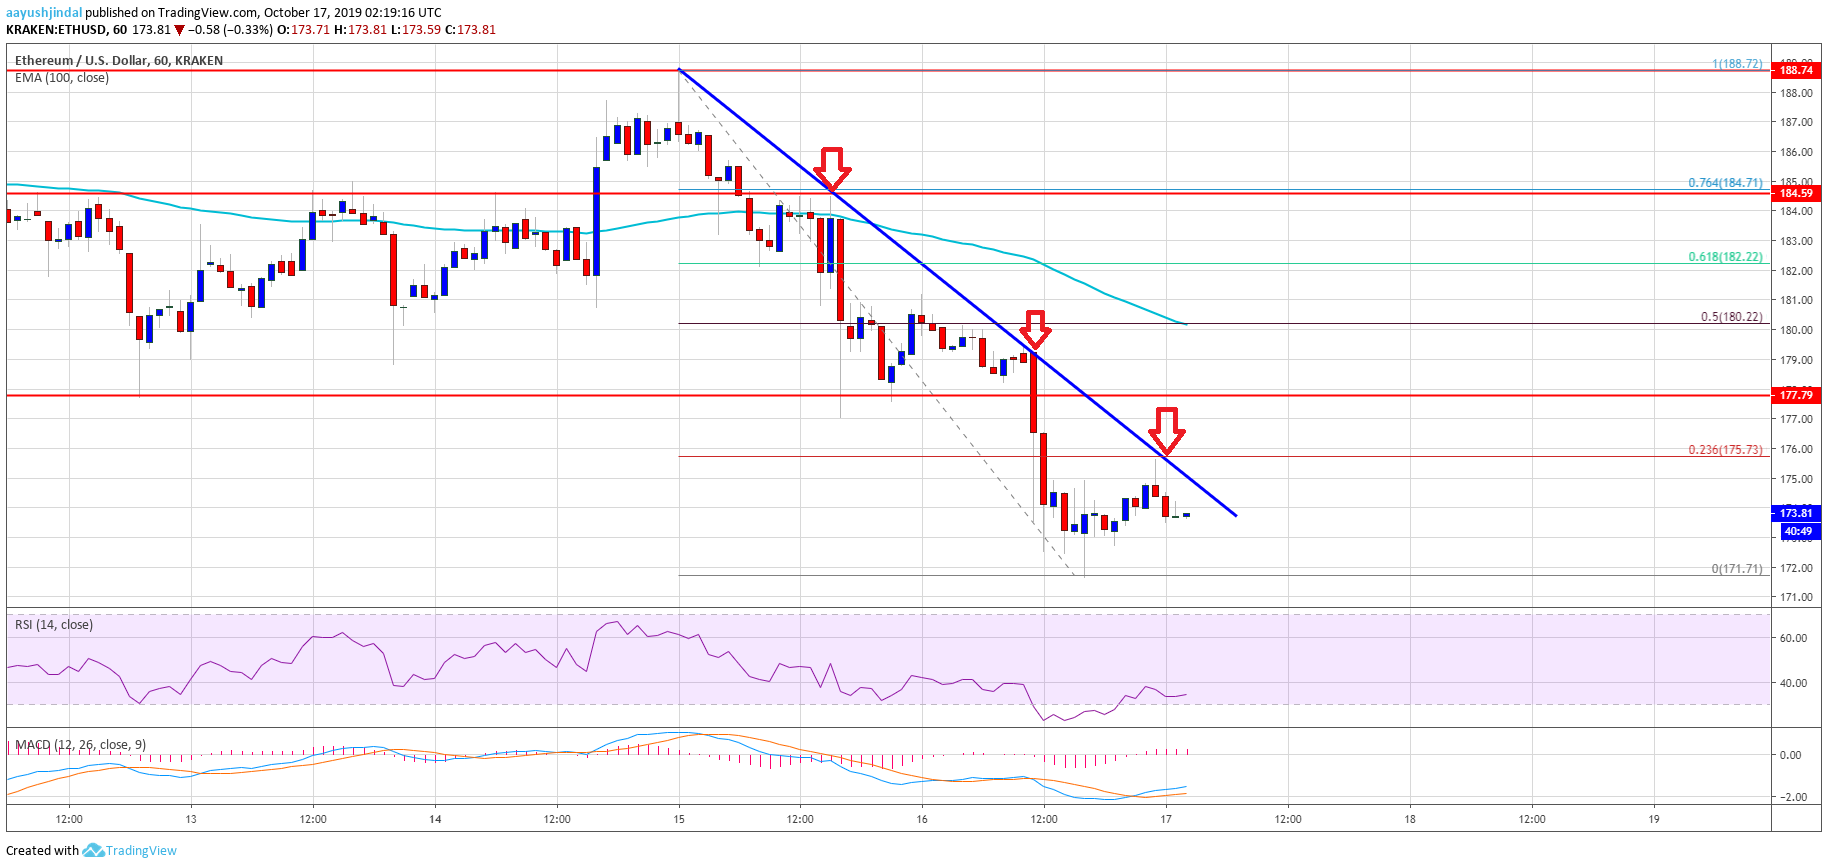
- Yesterday’s highlighted key bearish trend line is intact with resistance near 5 on the hourly chart of ETH/USD (data feed via Kraken).
- The pair remains in a bearish zone and it could face resistance near 5 and 0 in the near term.
Ethereum price is under selling pressure versus the US Dollar, similar to bitcoin. ETH price remains at a risk of more losses below the 0 level.
Ethereum Price Analysis
Yesterday, we saw bearish signs for Ethereum below the 5 resistance area against the US Dollar. ETH price remained in a bearish zone and even broke the 0 support. Moreover, there was a close below 0 and the 100 hourly simple moving average. It opened the doors for more downsides and the price broke the key 5 support area. It traded close to the 0 level and a swing low was formed near 1.
At the moment, the price is consolidating losses above the 2 level. An immediate resistance is near the 5 level. Moreover, the 23.6% Fib retracement level of the recent drop from the 8 high to 1 low is near the 5 level. Besides, yesterday’s highlighted key bearish trend line is intact with resistance near 5 on the hourly chart of ETH/USD.
If there is an upside break above 5, the price could test the 7 resistance area. However, the next key resistance is near the 0 level. It represents the 50% Fib retracement level of the recent drop from the 8 high to 1 low. Additionally, the 100 hourly SMA is also positioned near the 0 level to act as a strong resistance if the price corrects higher in the near term.
On the downside, the 2 and 0 levels are immediate supports. If there is a downside break below the 0 support, the price could continue to decline. The next stop for the bears could be near the 0 level.
Looking at the chart, Ethereum price is trading in a bearish zone below the 0 resistance and the 100 hourly SMA. If there is an upside correction, the price is likely to face a strong resistance near the 0 and 5 levels. Therefore, there are high chances of more downsides below 0 in the coming sessions.
ETH Technical Indicators
Hourly MACD – The MACD for ETH/USD is about to move into the bearish zone.
Hourly RSI – The RSI for ETH/USD is now well below the 50 level, with a flat structure.
Major Support Level – 0
Major Resistance Level – 0
The post Ethereum (ETH) Dives To 0, Is 0 Next Bear Target? appeared first on NewsBTC.