- ETH price is still struggling to break the key 5 resistance area against the US Dollar.
- The price is currently correcting lower and it might find support near 8 or 5.
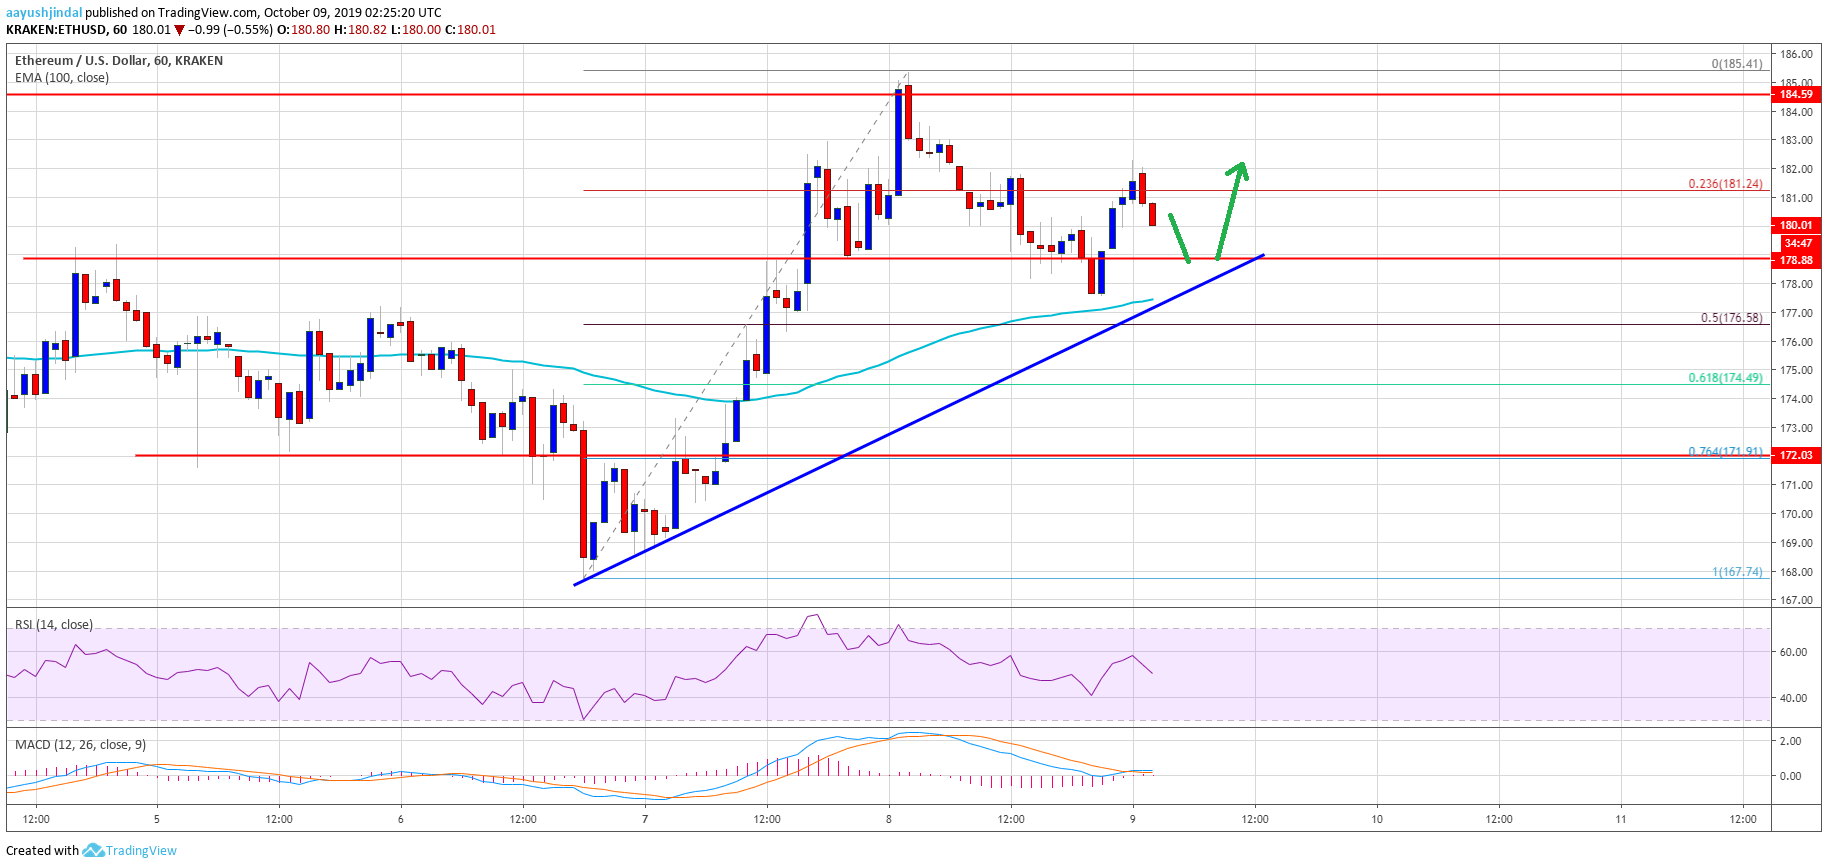
- There is a connecting bullish trend line forming with support near 8 on the hourly chart of ETH/USD (data feed via Kraken).
- The pair could retest the 5 resistance area as long as it is trading above the 5 support.
Ethereum price is struggling to continue higher versus the US Dollar and bitcoin. ETH price remains at a risk if it fails to stay above the main 5 support area.
Ethereum Price Analysis
Yesterday, we saw a nice 10% rally in Ethereum above the 5 resistance against the US Dollar. ETH price even broke the 0 resistance and the 100 hourly simple moving average. However, the main 5 resistance acted as a hurdle and prevented more gains. A high was formed near 5 and the price started a downside correction. It broke the 0 level to start the correction.
Moreover, there was a break below the 23.6% Fib retracement level of the upward move from the 8 swing low to 5 high. However, the price stayed above the 8 support and the 100 hourly SMA. Additionally, there is a connecting bullish trend line forming with support near 8 on the hourly chart of ETH/USD. The next support is near the 6 level. It coincides with the 50% Fib retracement level of the upward move from the 8 swing low to 5 high.
However, the main support is near the 5 level, where the bulls are likely to prevent additionally declines. If there is a downside break below 5 and the 61.8% Fib retracement level of the upward move from the 8 swing low to 5 high, the price could move back into a bearish zone. The next support is near the 2 level.
On the upside, an immediate resistance is near the 2 level. Having said that, the key resistance is near the 5 level. A successful break above the 5 resistance area is must for upside continuation in the near term.
Looking at the chart, Ethereum price is clearly struggling to clear the key 5 resistance area. Therefore, there could be an extended decline towards the 5 support area. It seems like the price might make another attempt to clear the 5 resistance. If it fails again, there could be a sharp decline below 5.
ETH Technical Indicators
Hourly MACD – The MACD for ETH/USD is struggling to gain pace in the bullish zone.
Hourly RSI – The RSI for ETH/USD is currently approaching the 50 level.
Major Support Level – 5
Major Resistance Level – 5
The post Ethereum (ETH) Price Still Capped By Key 5 Resistance appeared first on NewsBTC.