- ETH price is showing positive signs above the 2 and 0 support levels against the US Dollar.
- The price is currently trading near 0 and it might soon retest the 5 resistance area.
- Yesterday’s highlighted key bullish trend line is active with support near 2 on the hourly chart of ETH/USD (data feed via Kraken).
- The price is likely to accelerate gains if it succeeds in clearing the 5 resistance area.
Ethereum price is slowly gaining momentum versus the US Dollar, similar to bitcoin. ETH price must break the 5 resistance area to continue higher in the near term.
Ethereum Price Analysis
After struggling near the 5 resistance, Ethereum corrected lower against the US Dollar. ETH price traded below the 0 support area. Moreover, there was a break below the 5 support and the 100 hourly simple moving average. However, the 2 support area remained intact and a low was formed near the 3 level. Recently, the price started a fresh increase and climbed above the 5 level.
Additionally, there was a break above the 50% Fib retracement level of the recent decline from the 5 high to 3 low. The price even climbed above the 0 level and tested the 2 area. It seems like the 61.8% Fib retracement level of the recent decline from the 5 high to 3 low is acting as a resistance. The main resistance is still near the 5 level.
A successful break and close above the 5 resistance is needed for the bulls to gain momentum. The next key resistances area near the 5 and 0 levels. On the downside, an initial support is near the 6 level and the 100 hourly SMA. More importantly, yesterday’s highlighted key bullish trend line is active with support near 2 on the hourly chart of ETH/USD.
Therefore, dips towards the 5 level remains supported. If there are more downsides, the 2 level might act as a decent support. To move back into a bearish zone, the bears need to push the price below the 0 level in the near term.
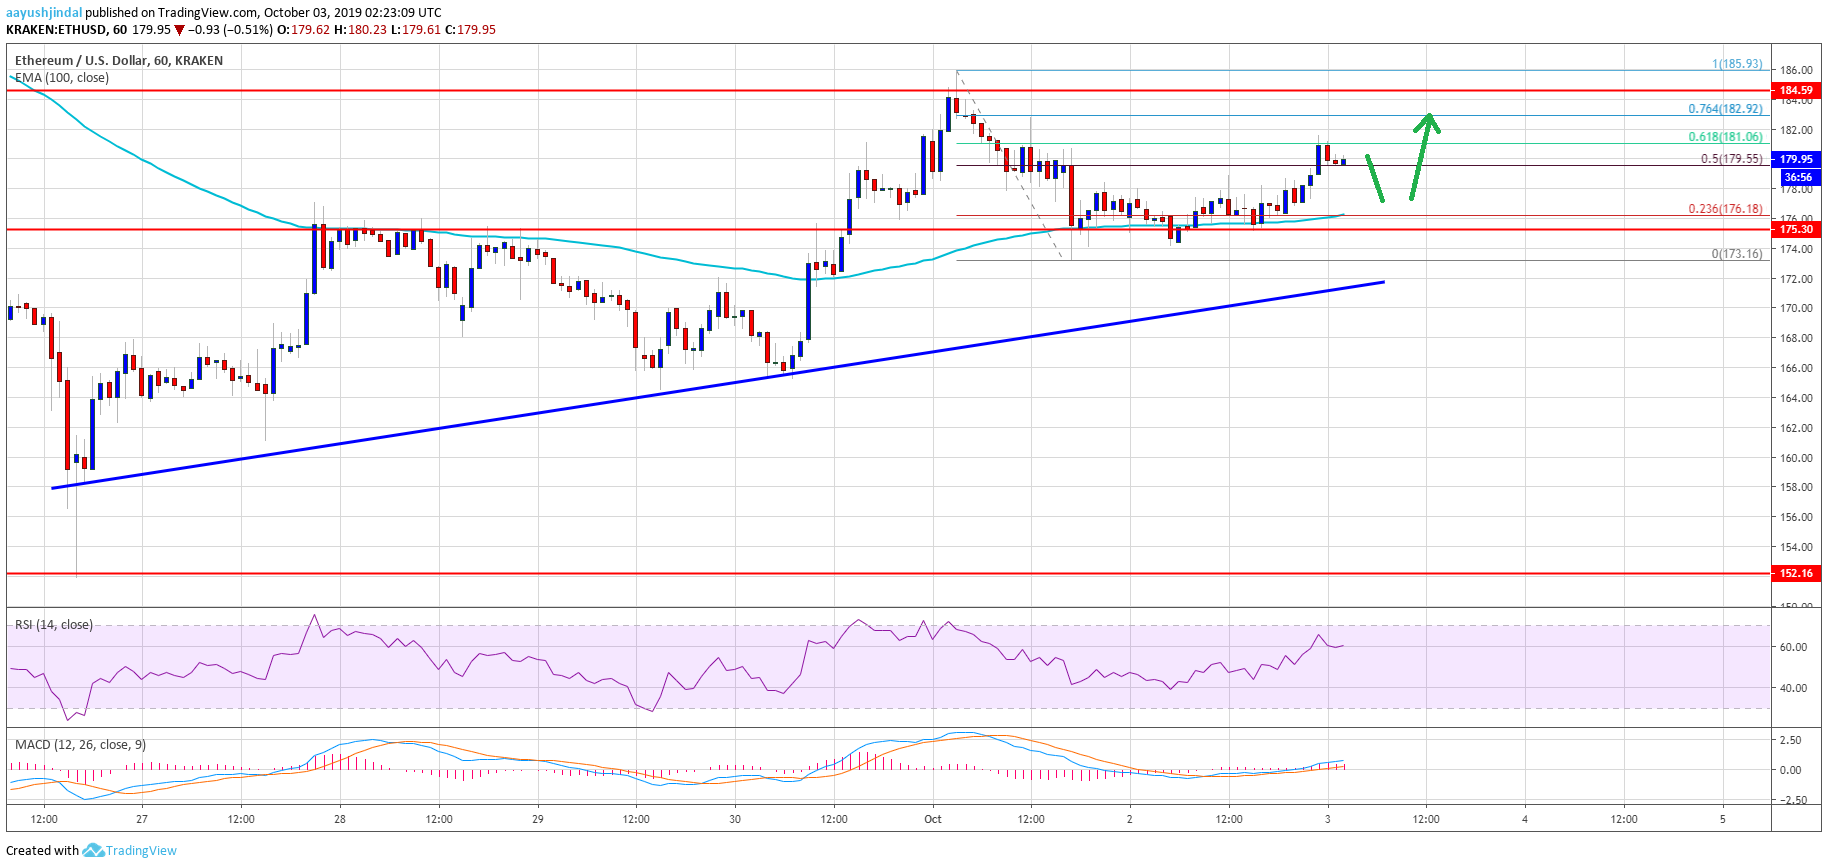
Looking at the chart, Ethereum price is clearly showing a few positive signs above the 2 and 5 support levels. However, the 5 level is a strong hurdle for the bulls. If there is a clear break above the 5 resistance, the price is likely to accelerate towards the 0 level (as discussed in yesterday’s analysis).
ETH Technical Indicators
Hourly MACD – The MACD for ETH/USD is showing positive signs in the bullish zone.
Hourly RSI – The RSI for ETH/USD is currently well below the 50 level, with bullish signs.
Major Support Level – 2
Major Resistance Level – 5
The post Ethereum (ETH) Price Above 5 Would Make Case For Larger Rally appeared first on NewsBTC.