- ETH price extended its decline and tested the 0 support area against the US Dollar.
- The price is currently correcting higher, but it is struggling to break the 5 resistance area.
- There was a break above a major declining channel with resistance near 3 on the hourly chart of ETH/USD (data feed via Kraken).
- The bulls need to push the price above 5 and the 100 hourly simple moving average.
Ethereum price is facing hurdles near 5 versus the US Dollar, while bitcoin is consolidating. ETH price could decline again before it attempts a fresh increase.
Ethereum Price Analysis
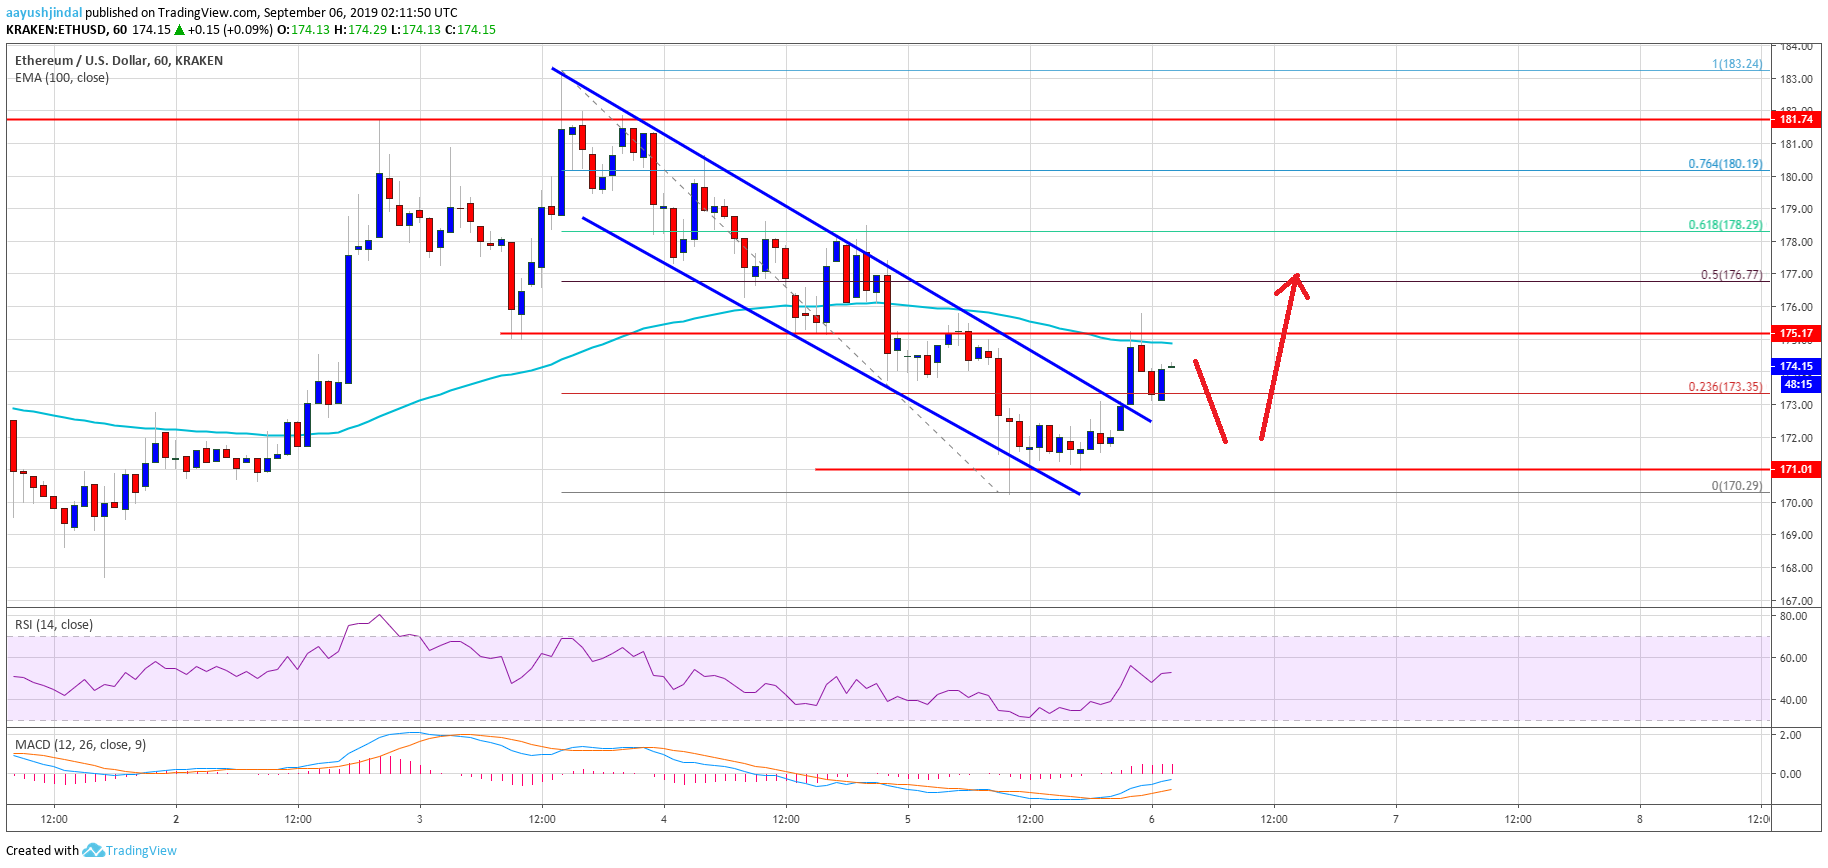
Yesterday, we saw a bearish reaction in ETH price below the 8 level against the US Dollar. However, bitcoin price remained well bid above the ,400 and ,500 support levels. Recently, Ethereum price extended its decline below the 5 level and the 100 hourly simple moving average. Moreover, there was a break below the 2 level and the price tested the 0 support area.
A swing low was formed near 0 and the price is currently correcting higher. It traded above the 2 resistance level. Moreover, the price climbed above the 23.6% Fib retracement level of the downward move from the 3 high to 0 swing low. More importantly, there was a break above a major declining channel with resistance near 3 on the hourly chart of ETH/USD.
However, Ethereum price seems to be facing a strong resistance near the 5 level. Additionally, the 100 hourly simple moving average is also stopping gains near the 5 level. The next key resistance is near the 8 level. It coincides with the 50% Fib retracement level of the downward move from the 3 high to 0 swing low. The main hurdles for the bulls are still near the 0 and 2 levels.
On the downside, an immediate support is near the 2 level. The main support is now near the 0 level, below which there is a risk of another drop towards the 8 support. The next key support is near the 2 pivot level.
Looking at the chart, Ethereum price is clearly struggling to clear the 5 resistance area and the 100 hourly SMA. Therefore, there could be another bearish reaction before the price attempts an upside break above 5. The next key resistances are near the 8 and 0 levels. A convincing close above the 0 level is needed for a sustained upward move.
ETH Technical Indicators
Hourly MACD – The MACD for ETH/USD is currently placed in the bullish zone.
Hourly RSI – The RSI for ETH/USD is currently well above the 50 level, with a positive bias.
Major Support Level – 0
Major Resistance Level – 8
The post Ethereum Price (ETH) Struggling Near 100 SMA While Bitcoin Consolidating appeared first on NewsBTC.