- ETH price climbed sharply above 0, but it struggled to clear the 5-320 resistance against the US Dollar.
- The price corrected lower, declined below the 0 level, and found support near the 5 level.
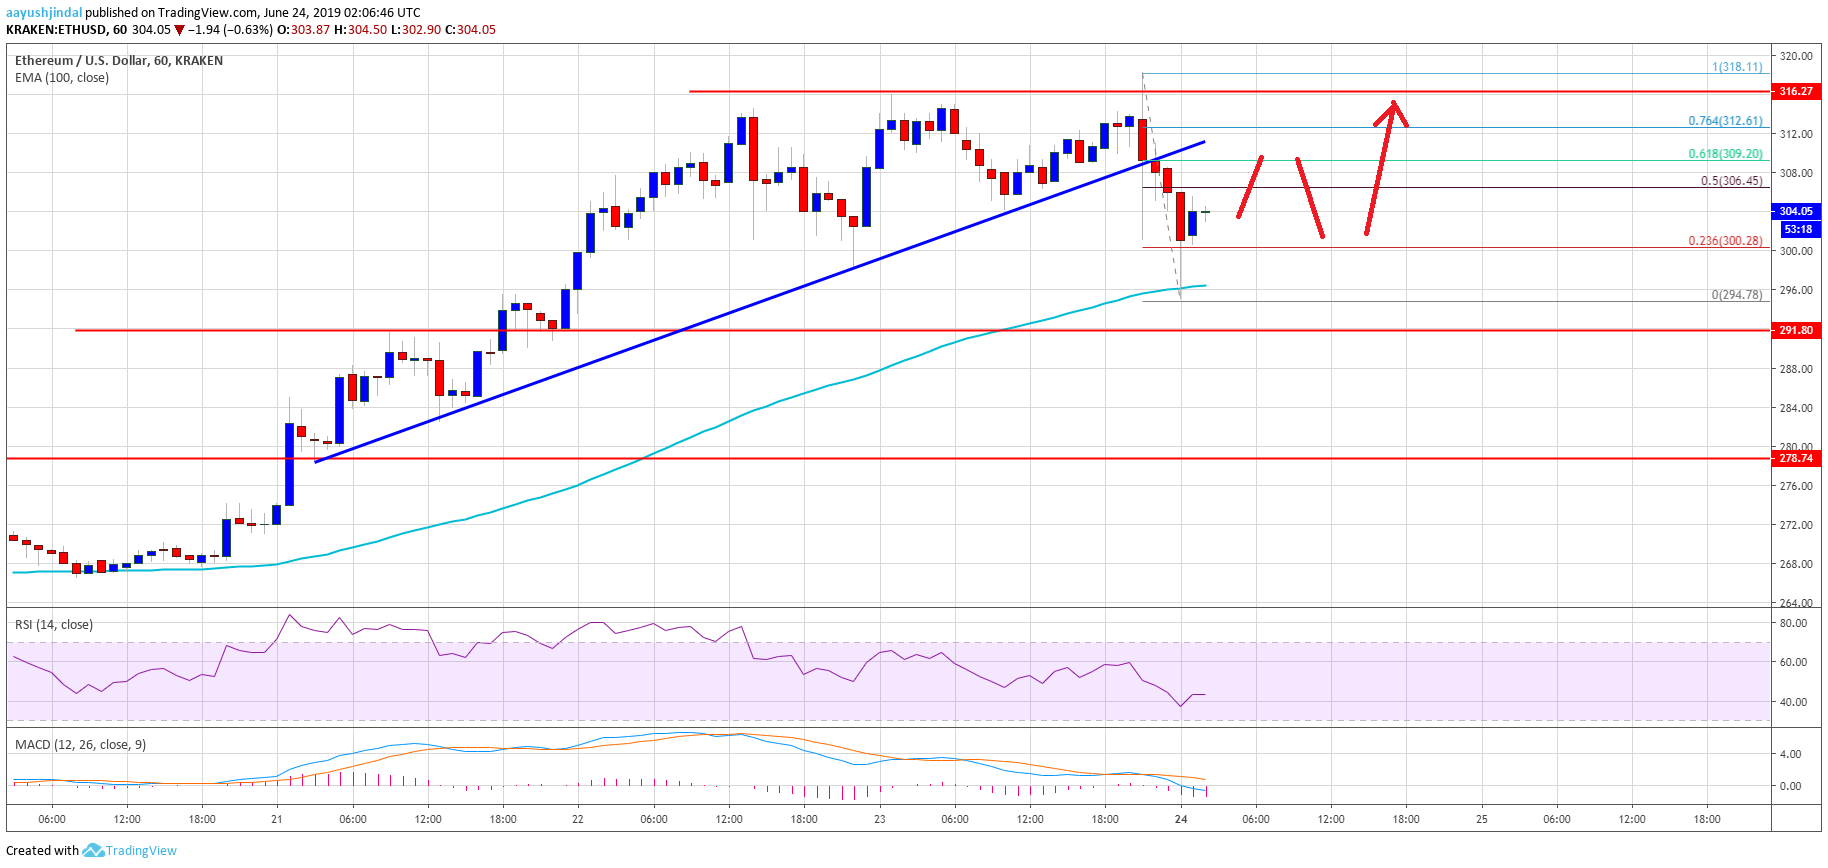
- There was a break below a major bullish trend line with support near 0 on the hourly chart of ETH/USD (data feed via Kraken).
- The pair is currently correcting higher, but there are chances of more ranges moves below 0.
Ethereum price is currently consolidating gains in a broad range versus the US Dollar, just like bitcoin. ETH price must stay above 5 and 0 to climb higher once again.
Ethereum Price Analysis
This past week, we saw solid gains in bitcoin and Ethereum above 0 and ,000 respectively against the US Dollar. The ETH/USD pair gained momentum above the 5 and 0 levels. There was even a close above the 0 level and the 100 hourly simple moving average. The price traded close to the 0 level and a swing high was formed near 8.
It seems like the price struggled to continue above the 5-320 resistance area. As a result, there was a downside correction below the 0 level. There was a break below a major bullish trend line with support near 0 on the hourly chart of ETH/USD. Ethereum price even declined below the 0 support levels. However, the 100 hourly SMA acted as a strong support near the 5 level.
A swing low is formed at 5 and the price is currently moving higher. It is trading above the 23.6% Fib retracement level of the downward move from the 8 high to 5 swing low. On the upside, there are a few hurdles for the bulls near 6 and 0. The 50% Fib retracement level of the downward move from the 8 high to 5 swing low is near the 6 level to prevent upsides.
Moreover, the main resistance is near the 0 level. Therefore, ETH must climb above the 0 level to start a fresh increase. The next key resistances are near 5 and 0, above which the price may perhaps accelerate higher.
Looking at the chart, Ethereum price is facing a lot of resistance below 0. Therefore, there are chances of range moves before the next move (probably above 0 and 5). On the downside, the main support is near the 5 level and the 100 hourly SMA, followed by 0.
ETH Technical Indicators
Hourly MACD – The MACD for ETH/USD is currently gaining strength in the bearish zone.
Hourly RSI – The RSI for ETH/USD is currently below the 50 level, with a few positive signs.
Major Support Level – 5
Major Resistance Level – 0
The post Ethereum (ETH) Price Struggling Below 0: Range Moves Before Higher? appeared first on NewsBTC.