- ETH price started a solid upward move after testing the 8 support area against the US Dollar.
- The price reversed most its losses, but it is still struggling to clear the 0 resistance area.
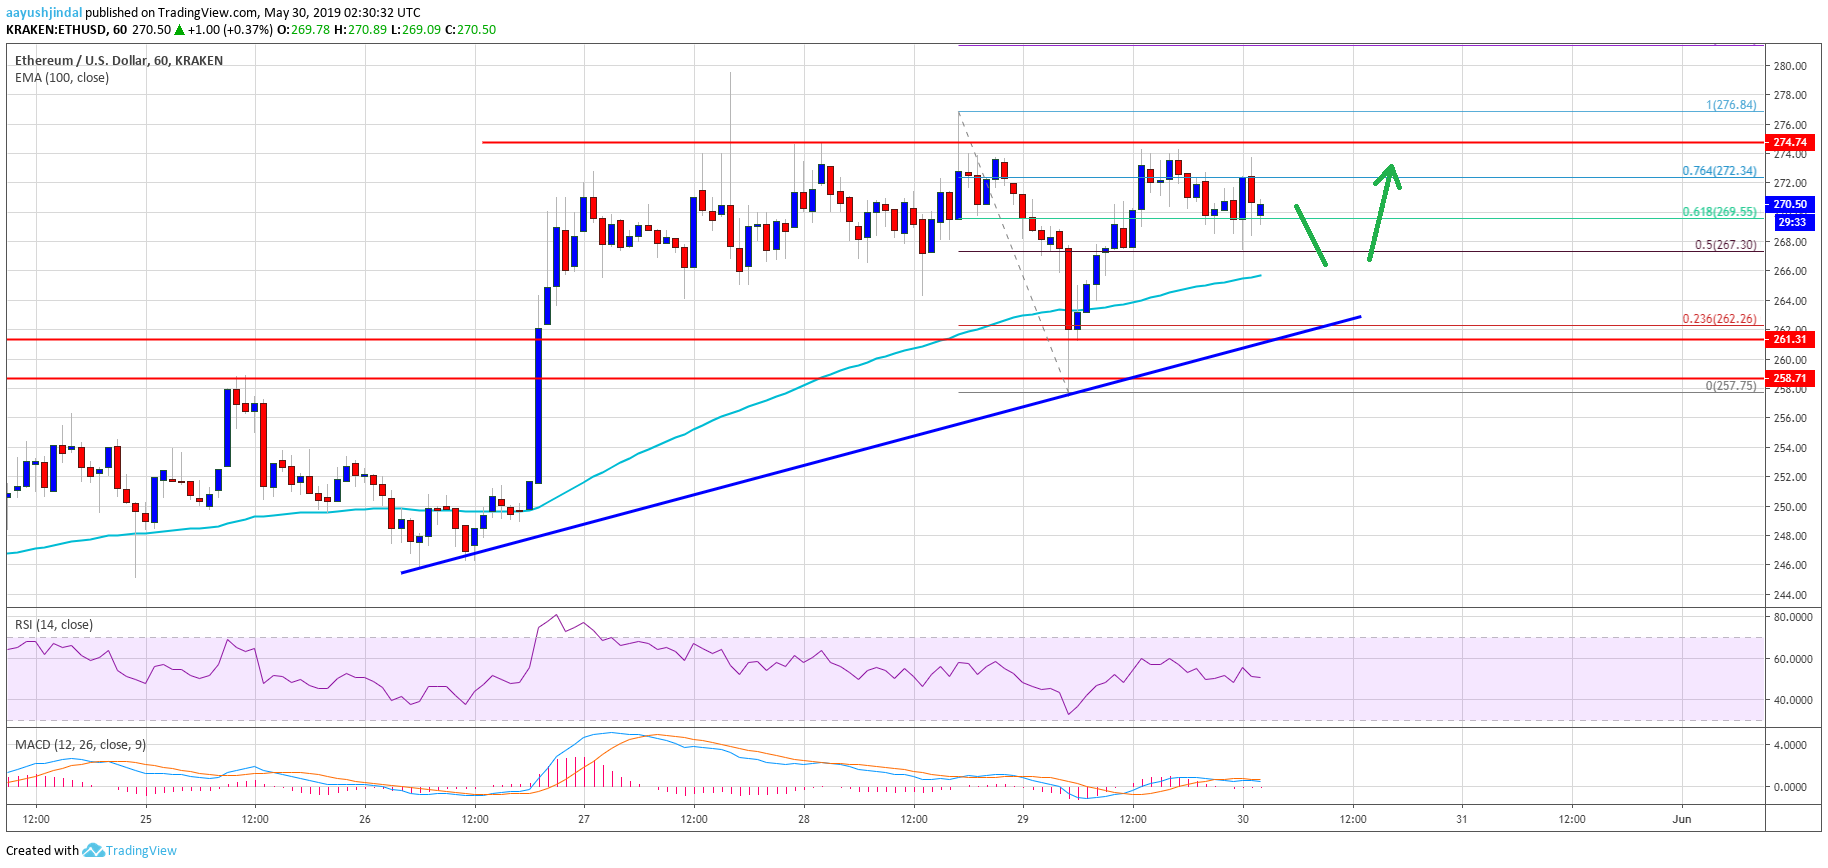
- There is a new connecting bullish trend line forming with support near 2 on the hourly chart of ETH/USD (data feed via Kraken).
- The pair must break the 0 barrier to start a fresh increase towards the 0 and 5 levels.
Ethereum price is showing positive signs after the recent reversal versus the US Dollar, but consolidating vs bitcoin. ETH price is once again trading near the key 0 resistance area.
Ethereum Price Analysis
Recently, there was a major downside correction in Ethereum price below the 0 and 5 supports against the US Dollar. The ETH/USD pair even spiked below the 0 support and the 100 hourly simple moving average. However, the 8 level acted as a strong support and protected losses. As a result, there was a sharp upward move above 0 and 5. The price reversed most its gains and broke the 61.8% Fib retracement level of the last decline from the 6 high to 8 low.
The price is currently trading well above the 5 level and the 100 hourly simple moving average. It even climbed above the 76.4% Fib retracement level of the last decline from the 6 high to 8 low. However, the 6 and 0 resistance levels are still acting as a solid barriers for the bulls. If there is an upside break above the 4 and 6 levels, the price could start a strong upward move. The next key resistances are near 0 and 8.
On the downside, an initial support is near the 8 level. There is also a new connecting bullish trend line forming with support near 2 on the hourly chart of ETH/USD. Therefore, if there is a downside correction, the price is likely to find bids near 5 or 2. If there are further losses, the price might revisit the 8 support area in the near term.
Looking at the chart, Ethereum price is back above key supports and trading in a range above the 5 support. Having said that, the bulls need to take control and push the price above 4, 6 and 0. If they continue to struggle, there is a risk of more losses below the 2 and 8 support levels in the coming sessions.
ETH Technical Indicators
Hourly MACD – The MACD for ETH/USD is slowly moving into the bearish zone, with negative signs.
Hourly RSI – The RSI for ETH/USD is currently well above the 50 level, with positive signs.
Major Support Level – 2
Major Resistance Level – 6
The post Ethereum (ETH) Price Resumes Upside: Can Bulls Break 0? appeared first on NewsBTC.