- ETH price corrected lower and found support near the 4 level against the US Dollar.
- The price found a strong buying interest and it is currently moving higher towards 5.
- Yesterday’s highlighted important bullish trend line is active with support at 5 on the hourly chart of ETH/USD (data feed via Kraken).
- The pair is showing positive signs above the 5 level and it could continue to move higher.
Ethereum price is holding key support levels versus the US Dollar and bitcoin. ETH is slowly climbing higher and it is likely to continue towards the 4 and 5 levels.
Ethereum Price Analysis
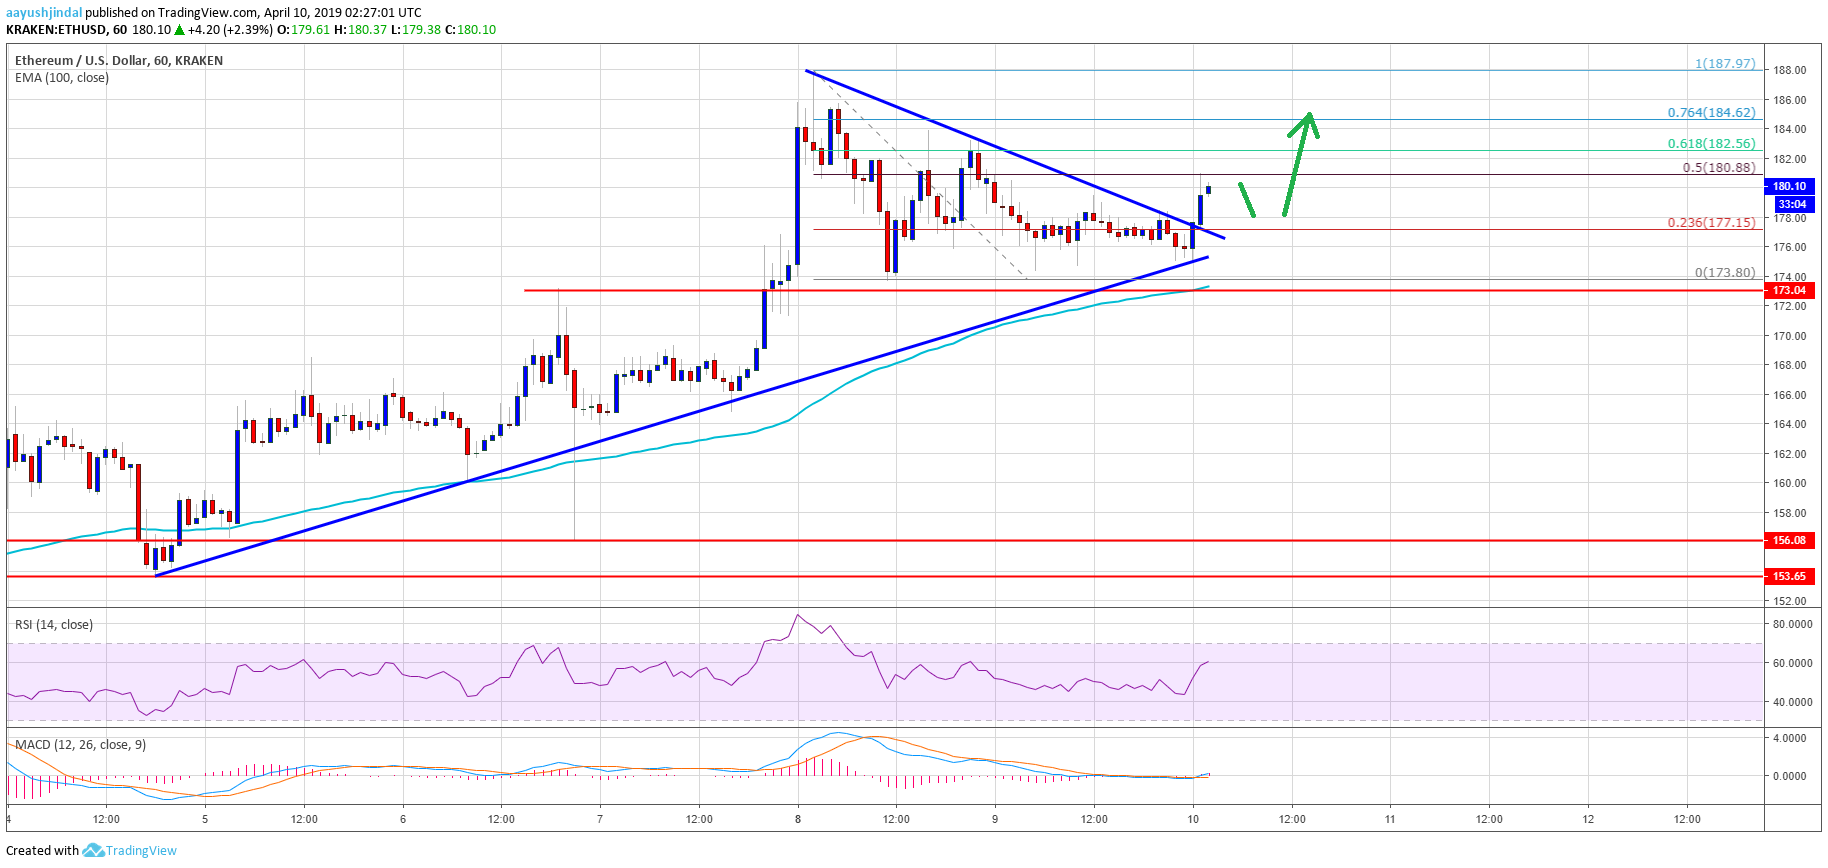
Recently, there was a fresh downside correction from the 8 swing high in Ethereum price against the US Dollar. The ETH/USD pair declined below the 4 and 0 support levels. The price even broke the 6 level, but it found a strong buying interest near the 4 level. Moreover, the 61.8% Fib retracement level of the last leg from the 4 low to 8 high acted as a support. The price formed a decent support base above the 4 level and it recently moved higher.
It broke the 6 resistance and the 23.6% Fib retracement level of the recent drop from the 8 swing high to 4 low. More importantly, there was a break above a connecting bearish trend line with resistance at 7 on the hourly chart of ETH/USD. It opened the doors for more gains and the price recently tested the 0 level. It seems like the 50% Fib retracement level of the recent drop from the 8 swing high to 4 low is acting as a short term resistance.
If the price corrects lower, it is likely to find a decent buying interest near the 6 or 5 levels. Besides, yesterday’s highlighted important bullish trend line is active with support at 5 on the same chart. Therefore, it seems like Ethereum remains well supported on the downside near the 5 and 4 levels. On the upside, a break above the 0 level could push the price towards the 4 and 5 resistance levels.
Looking at the chart, Ethereum price is placed nicely in a positive zone above the 4 swing support. Only a close below the 4 level and the 100 hourly simple moving average could start a fresh decline. If not, the price is likely to continue higher towards 5. Above 5, the next stop for buyers could be near 8 or 0.
ETH Technical Indicators
Hourly MACD – The MACD for ETH/USD is slowly gaining momentum in the bullish zone.
Hourly RSI – The RSI for ETH/USD climbed higher above the 50 and 55 levels.
Major Support Level – 5
Major Resistance Level – 5
The post Ethereum (ETH) Price Signaling Bullish Continuation Above 0 appeared first on NewsBTC.