Key Highlights
- ETH price declined recently and traded below the support level against the US Dollar.
- Yesterday’s highlighted key contracting triangle is intact with current support at on the hourly chart of ETH/USD (data feed via Kraken).
- The pair is likely to break the triangle and decline further towards the or levels.
Ethereum price failed to recover against the US Dollar and bitcoin. ETH/USD is likely to decline once again if there is an hourly close below and .
Ethereum Price Analysis
After failing to clear the resistance, ETH price started a fresh decline against the US Dollar. The ETH/USD pair traded lower and broke the and support levels. It opened the doors for more losses and the price settled below and the 100 hourly simple moving average. At the moment, the price is trading near a major support area at , below which there could be a solid drop to .
More importantly, yesterday’s highlighted key contracting triangle is intact with current support at on the hourly chart of ETH/USD. On the upside, an initial resistance is near the level. It represents the 50% Fib retracement level of the last decline from the high to swing low. Besides, the 100 hourly SMA is also near the -93 area. The triangle resistance is near the level, which is a crucial hurdle for buyers. The 61.8% Fib retracement level of the last decline from the high to swing low is also near .
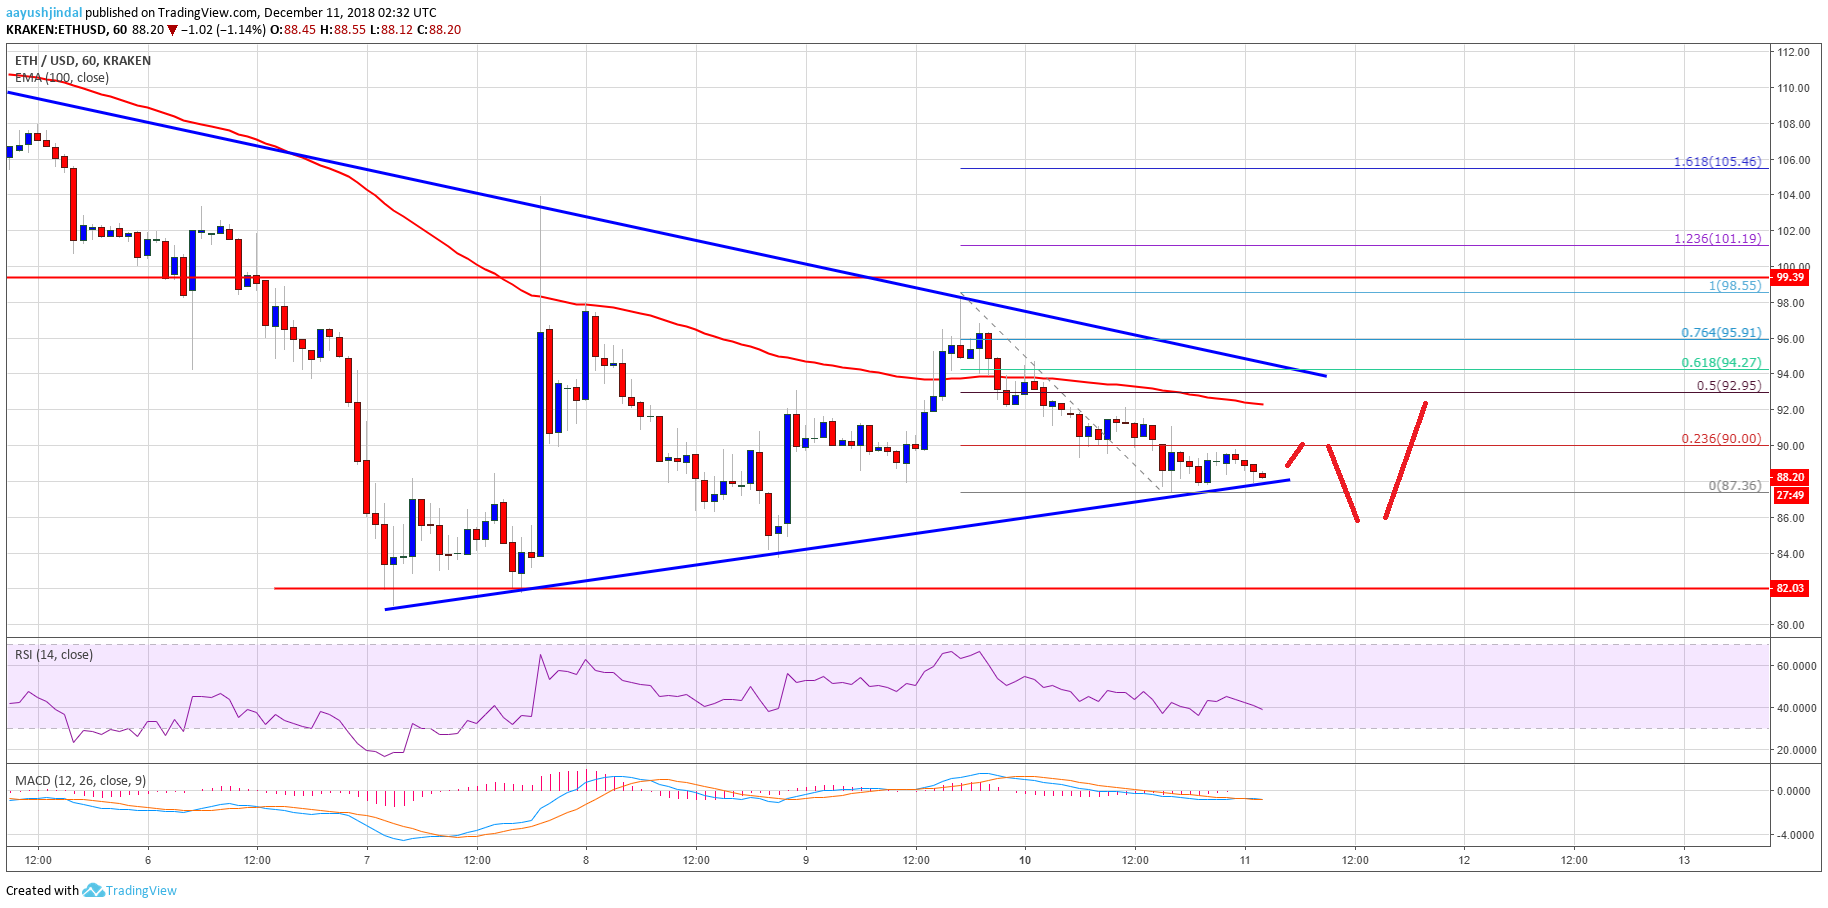
Looking at the chart, ETH price seems to be facing many hurdles near the and levels. Above , the main resistance is near the -100 zone. Therefore, the price could extend losses if buyers fail to gain pace above and then .
Hourly MACD – The MACD is currently flat in the bearish zone.
Hourly RSI – The RSI moved below the 50 level with a bearish angle.
Major Support Level –
Major Resistance Level –
The post Ethereum Price Analysis: ETH Near Make-or-Break Levels appeared first on NewsBTC.