Key Points
- Bitcoin price recovered recently and moved above the ,500 resistance against the US Dollar.
- There is a key bearish trend line in place with resistance at ,590 on the hourly chart of the BTC/USD pair (data feed from Kraken).
- The price must break the ,590 and ,650 resistance levels to gain bullish momentum.
Bitcoin price is facing a solid resistance near ,600-3,700 against the US Dollar. BTC must move past the ,700 pivot zone to accelerate gains towards ,000.
Bitcoin Price Analysis
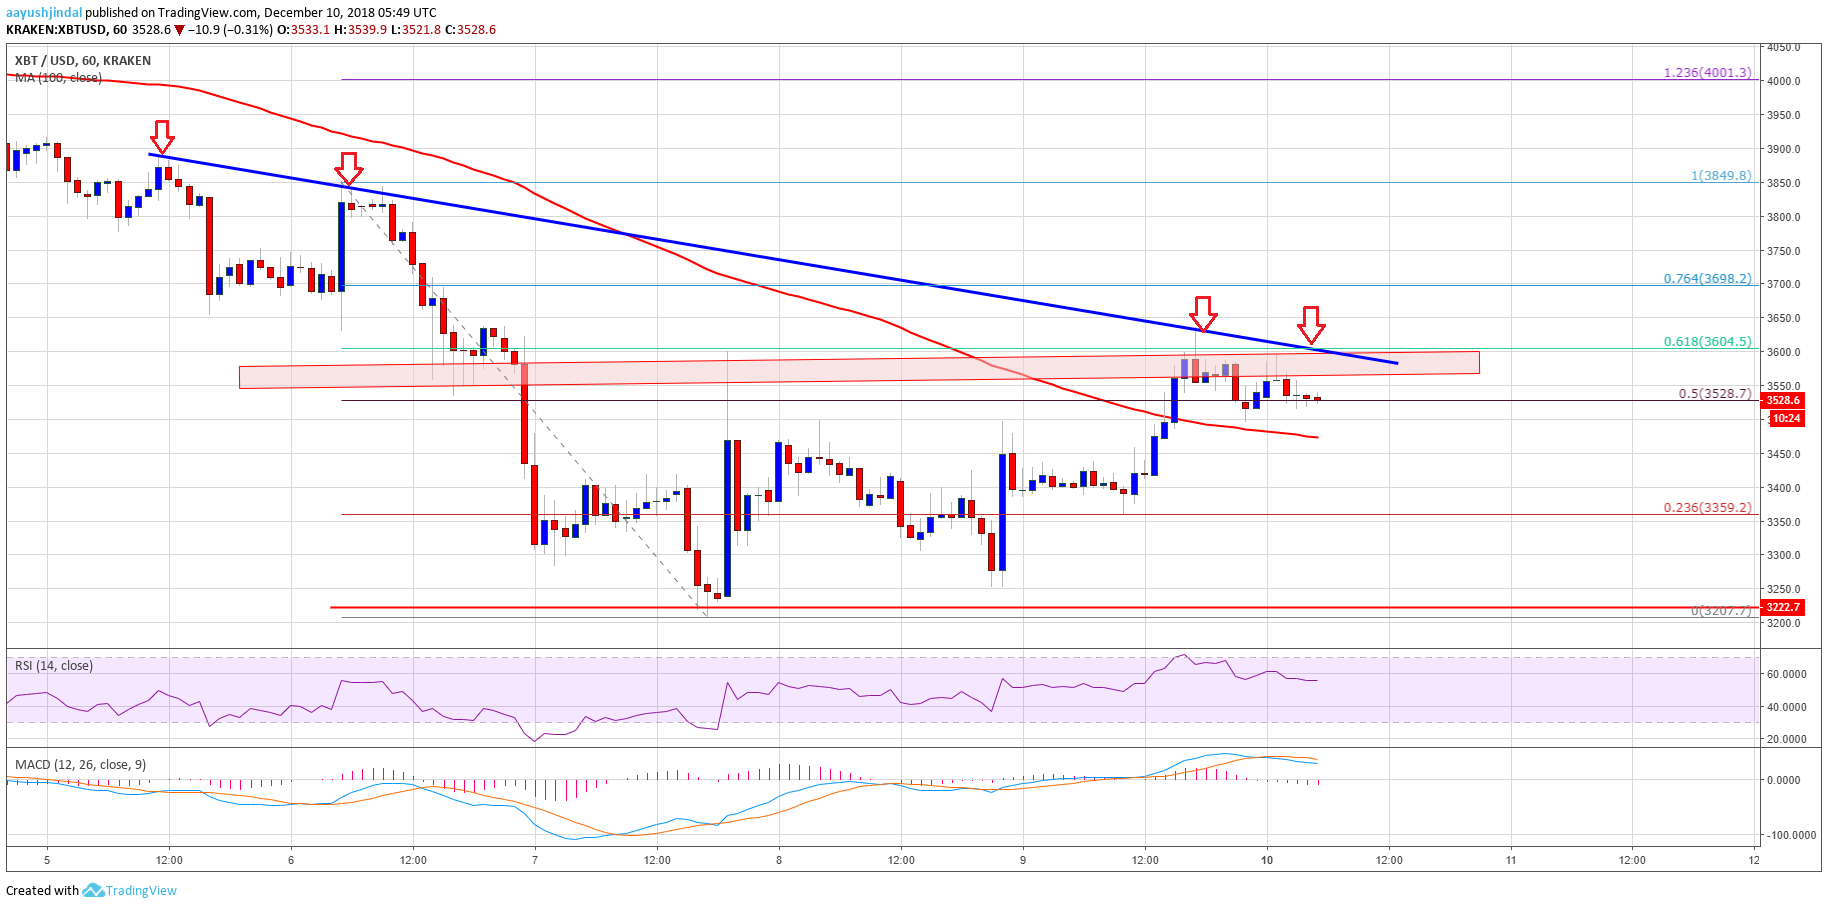
There was a decent support base formed near the ,350 level in bitcoin price against the US Dollar. The BTC/USD pair started an upward move and traded above the ,400 and ,500 resistance levels. The price even climbed above the 50% Fib retracement level of the last decline from the ,850 high to ,207 low. Finally, there was a close above the ,480 level and the 100 hourly simple moving average.
However, the price faced a solid resistance near the ,600 and ,620 levels. More importantly, there is a key bearish trend line in place with resistance at ,590 on the hourly chart of the BTC/USD pair. Besides, the 61.8% Fib retracement level of the last decline from the ,850 high to ,207 low is near ,605. Therefore, a break above the ,600-3,605 zone could push the price towards the next resistances at ,650 and ,700s. A successful close above the ,700 pivot zone is needed for buyers to gain traction in the near term. On the downside, an initial support is at ,480 and the 100 hourly SMA.
Looking at the chart, bitcoin price could only accelerate towards ,000 if there is a close above ,600 and ,700. If not, the price is likely to decline below ,500, ,480 and ,400.
Looking at the technical indicators:
Hourly MACD – The MACD for BTC/USD moved back in the bearish zone.
Hourly RSI (Relative Strength Index) – The RSI is placed nicely above the 50 level.
Major Support Level – ,400
Major Resistance Level – ,605
The post Bitcoin Price Watch: Break Above ,700 Could Push BTC Higher appeared first on NewsBTC.