Key Points
- Bitcoin cash price is under a lot of pressure after it broke the 0 support against the US Dollar.
- There is a major declining channel formed with resistance near 5 on the hourly chart of the BCH/USD pair (data feed from Kraken).
- The pair is currently trading near 5 and it may slide further towards the 0 level in the near term.
Bitcoin cash price registered heavy losses from the 0 swing high against the US Dollar. BCH/USD could continue to move down towards the 0 level.
Bitcoin Cash Price Analysis
Yesterday, we discussed that bitcoin cash price may slide further towards 5 against the US Dollar. The BCH/USD pair did trade lower after it broke the 0 and 5 support levels. The decline was such that the price even broke the 0 level and traded close to 5. It is now positioned well below the 0 level and the 100 hourly simple moving average.
The recent low was formed near 6 and the current price action suggests more gains. On the upside, an initial resistance is near the 23.6% Fib retracement level of the last decline from the 8 swing high to 6 low. More importantly, there is a major declining channel formed with resistance near 5 on the hourly chart of the BCH/USD pair. The pair is very unlikely to trade above the 5 and 0 resistance levels in the short term. Above 0, the next resistance is the 50% Fib retracement level of the last decline from the 8 swing high to 6 low. On the downside, a close below the 5 level could push the price towards 0 or 0.
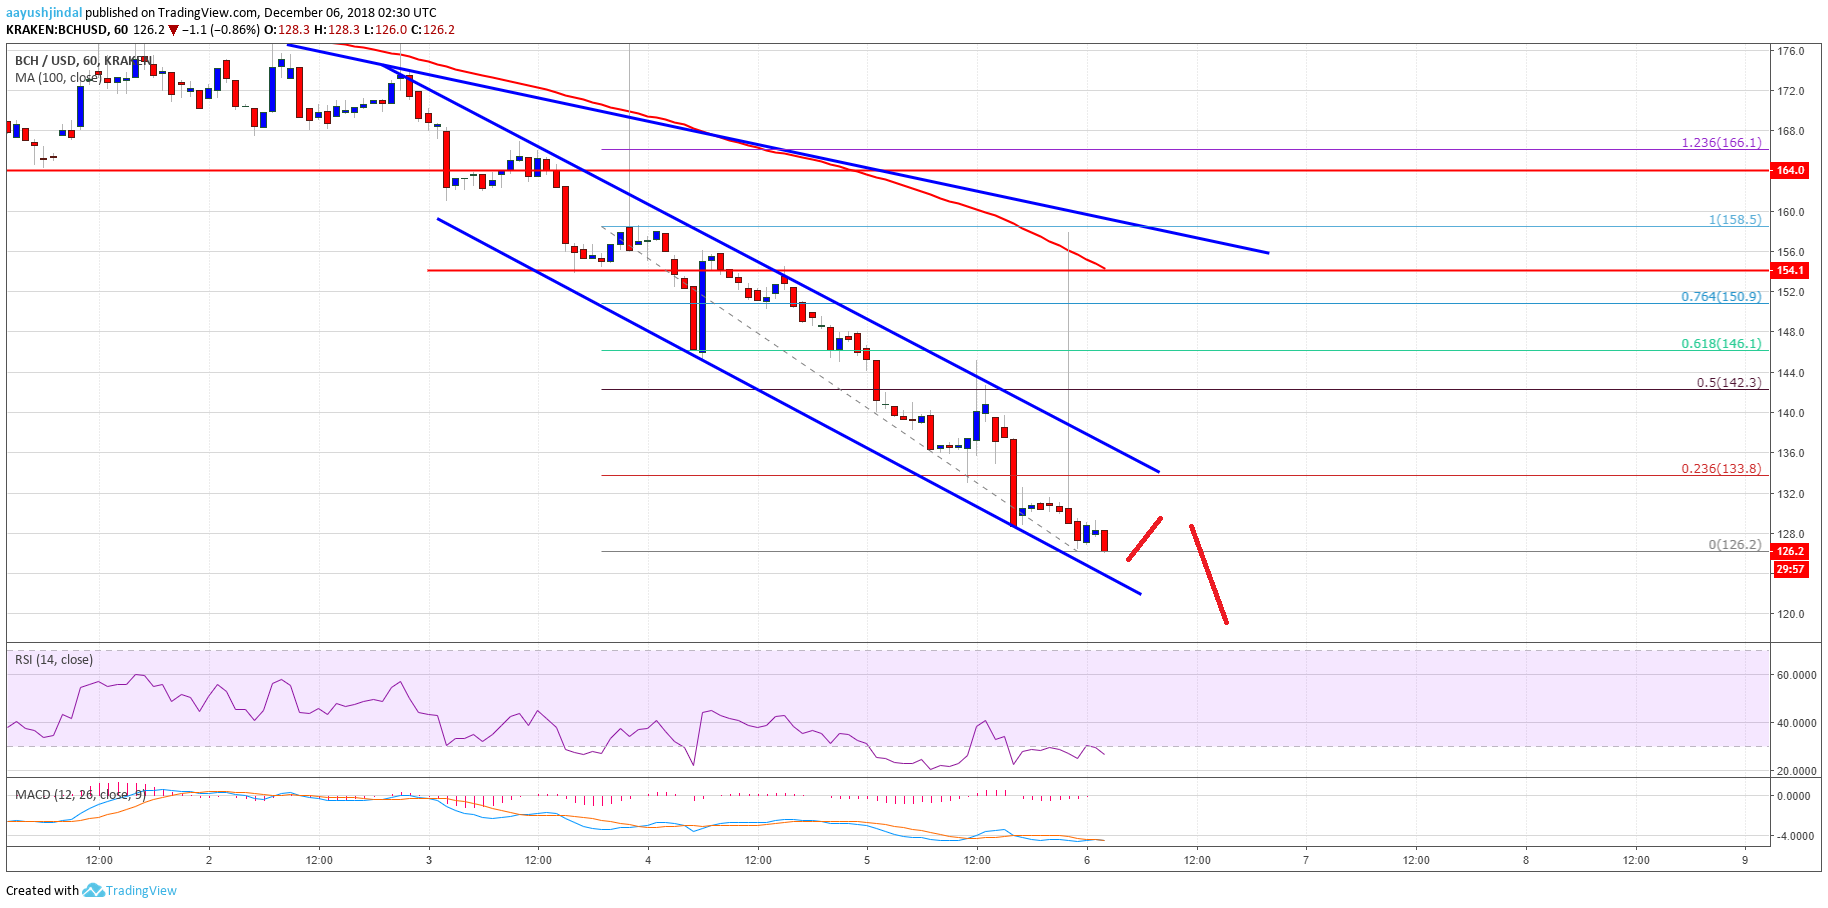
Looking at the chart, BCH price is clearly in a significant downtrend below 0. It is likely to slide further towards 0, 0 or 0.
Looking at the technical indicators:
Hourly MACD – The MACD for BCH/USD is placed in the bearish zone.
Hourly RSI (Relative Strength Index) – The RSI for BCH/USD is well below the 30 level.
Major Support Level – 0
Major Resistance Level – 5
The post Bitcoin Cash Price Analysis: BCH/USD Primed To Test 0 appeared first on NewsBTC.