Key Points
- Bitcoin cash price broke the 0 and 5 support levels plus extended losses against the US Dollar.
- There is a major bearish trend line formed with resistance near 8 on the hourly chart of the BCH/USD pair (data feed from Kraken).
- The pair is currently under a lot of pressure and it could decline further below 0.
Bitcoin cash price faced an increased selling pressure below 5 against the US Dollar. BCH/USD could even break the 0 support level and trade towards 0.
Bitcoin Cash Price Analysis
After failing near the 5 resistance, bitcoin cash price started a fresh decline against the US Dollar. The BCH/USD pair extended declines recently and broke the 0 and 5 support levels. The price is now trading well below the 0 level and the 100 hourly simple moving average. Earlier, there was an upward move, but the price failed to break the 5 and 0 resistance levels.
During the recent decline, the price broke the 0 support and traded as low as 4. The price is currently consolidating above 0 and it is preparing for the next move. An initial resistance is the 23.6% Fib retracement level of the recent decline from the 6 high to 4 low. However, the main resistance is near the 0 level. Moreover, there is a major bearish trend line formed with resistance near 8 on the hourly chart of the BCH/USD pair. The trend line is close to the 50% Fib retracement level of the recent decline from the 6 high to 4 low.
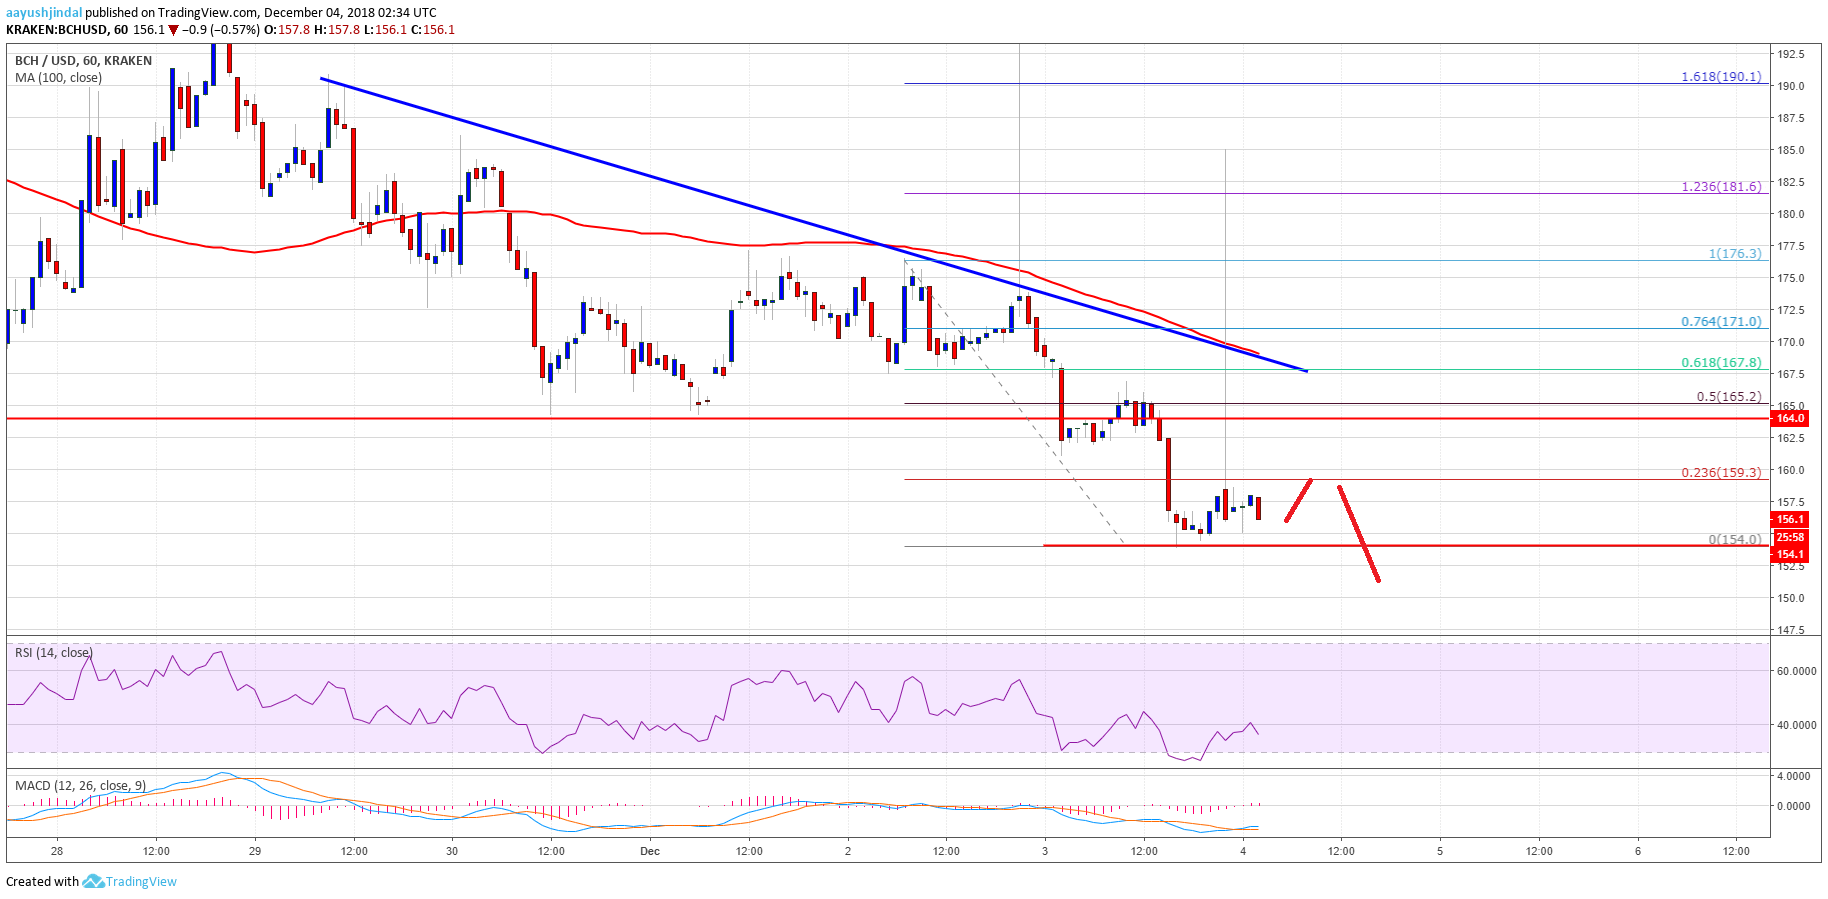
Looking at the chart, BCH price is likely to break the 4 low and if sellers gain strength, they may even break 0. The next major support below 0 is near the 0 level.
Looking at the technical indicators:
Hourly MACD – The MACD for BCH/USD is slightly placed in the bullish zone.
Hourly RSI (Relative Strength Index) – The RSI for BCH/USD is now below the 40 level.
Major Support Level – 5
Major Resistance Level – 0
The post Bitcoin Cash Price Analysis: BCH/USD Could Extend Losses Below 0 appeared first on NewsBTC.