Key Highlights
- ADA price started a decent recovery after forming a support at .0350 against the US Dollar (tethered).
- There is a short term bullish trend line formed with support at .0410 on the hourly chart of the ADA/USD pair (data feed via Bittrex).
- The pair is likely to climb further higher and it may even break .0450 in the near term.
Cardano price recovered recently against the US Dollar and Bitcoin. ADA/USD may accelerate gains above the .0440 and .0450 resistance levels.
Cardano Price Analysis
After forming a support base the near the .0350, cardano price started an upward move against the US Dollar. The ADA/USD pair climbed higher and broke the .0380 and .0400 resistance levels. The price even settled above the .0400 level and the 100 hourly simple moving average. It traded close to the .0450 resistance and formed a high near the .0448 level. Later, the price corrected lower and moved below .0420.
There was a break below the 23.6% Fibonacci retracement level of the last wave from the .0343 low to .0448 high. However, there are many supports near the .0400 level. More importantly, there is a short term bullish trend line formed with support at .0410 on the hourly chart of the ADA/USD pair. Below the trend line, the next key support is near the .0395 level. It represents the 50% Fibonacci retracement level of the last wave from the .0343 low to .0448 high. On the upside, an initial resistance is at .0440 and .0450. Above .0450, the price is likely to accelerate gains towards the .0500 level.
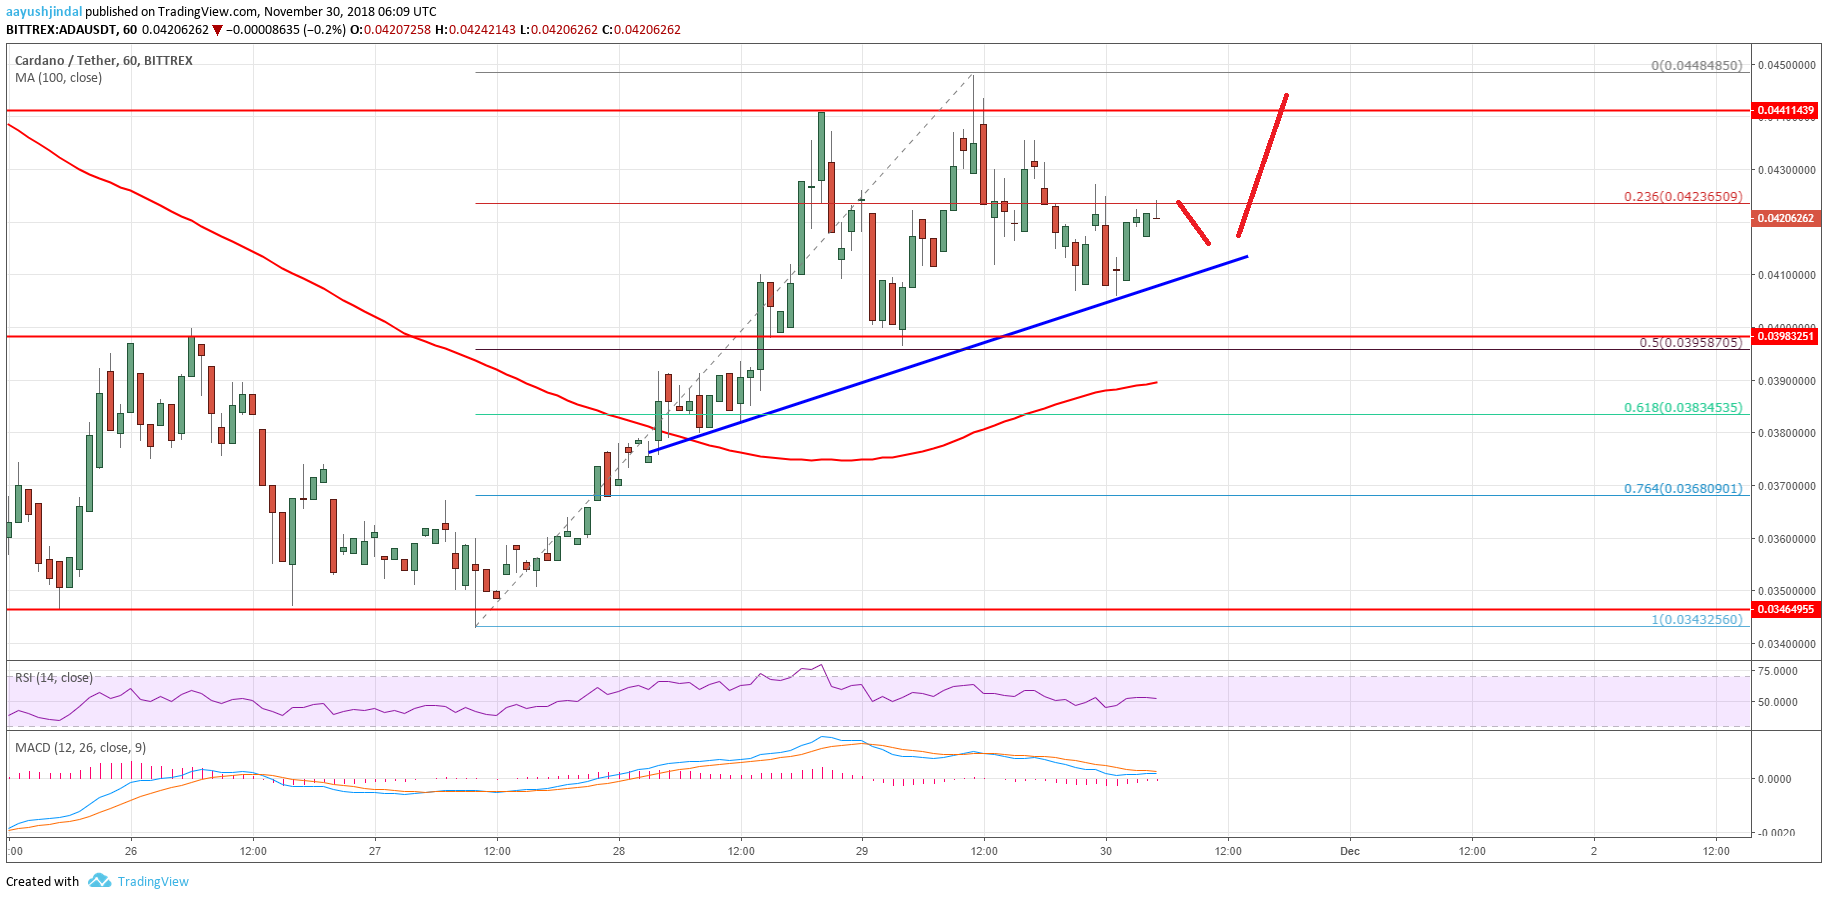
The chart indicates that ADA price is placed nicely above the .0390 support and the 100 hourly SMA. If buyers remain in action, there are high chances of more gains above the .0450 resistance.
Hourly MACD – The MACD for ADA/USD is about to move into the bullish zone.
Hourly RSI – The RSI for ADA/USD is now just above the 55 level.
Major Support Level – .0390
Major Resistance Level – .0450
The post Cardano Price Analysis: ADA/USD Could Climb Above .045 appeared first on NewsBTC.