Key Points
- Bitcoin cash price failed to break the 5 and 8 resistance levels against the US Dollar.
- There is a crucial contracting triangle forming with resistance near 8 on the hourly chart of the BCH/USD pair (data feed from Kraken).
- The pair is likely to make the next move either above 8 or below 5 in the near term.
Bitcoin cash price is struggling to clear the 0 hurdle against the US Dollar. BCH/USD is approaching the next break either above 8-200 or towards 5.
Bitcoin Cash Price Analysis
There was a slow and steady rise from the 5 swing low in bitcoin cash price against the US Dollar. The BCH/USD pair traded above the 5 and 0 resistance levels to move into a positive zone. There was even a close above the 5 level and the 100 hourly simple moving average. However, the price struggled to clear the 8-200 resistance, which is a major hurdle for buyers.
A high was formed at 7 and later the price corrected lower. It declined below the 23.6% Fib retracement level of the last wave from the 6 low to 7 high. The price is now approaching a strong support near the 8-180 zone. Moreover, there is a crucial contracting triangle forming with resistance near 8 on the hourly chart of the BCH/USD pair. The triangle support is near the 100 hourly SMA at 6. Besides, the 61.8% Fib retracement level of the last wave from the 6 low to 7 high is at 8. Therefore, the 5-178 area could act as a strong support for buyers in the short term.
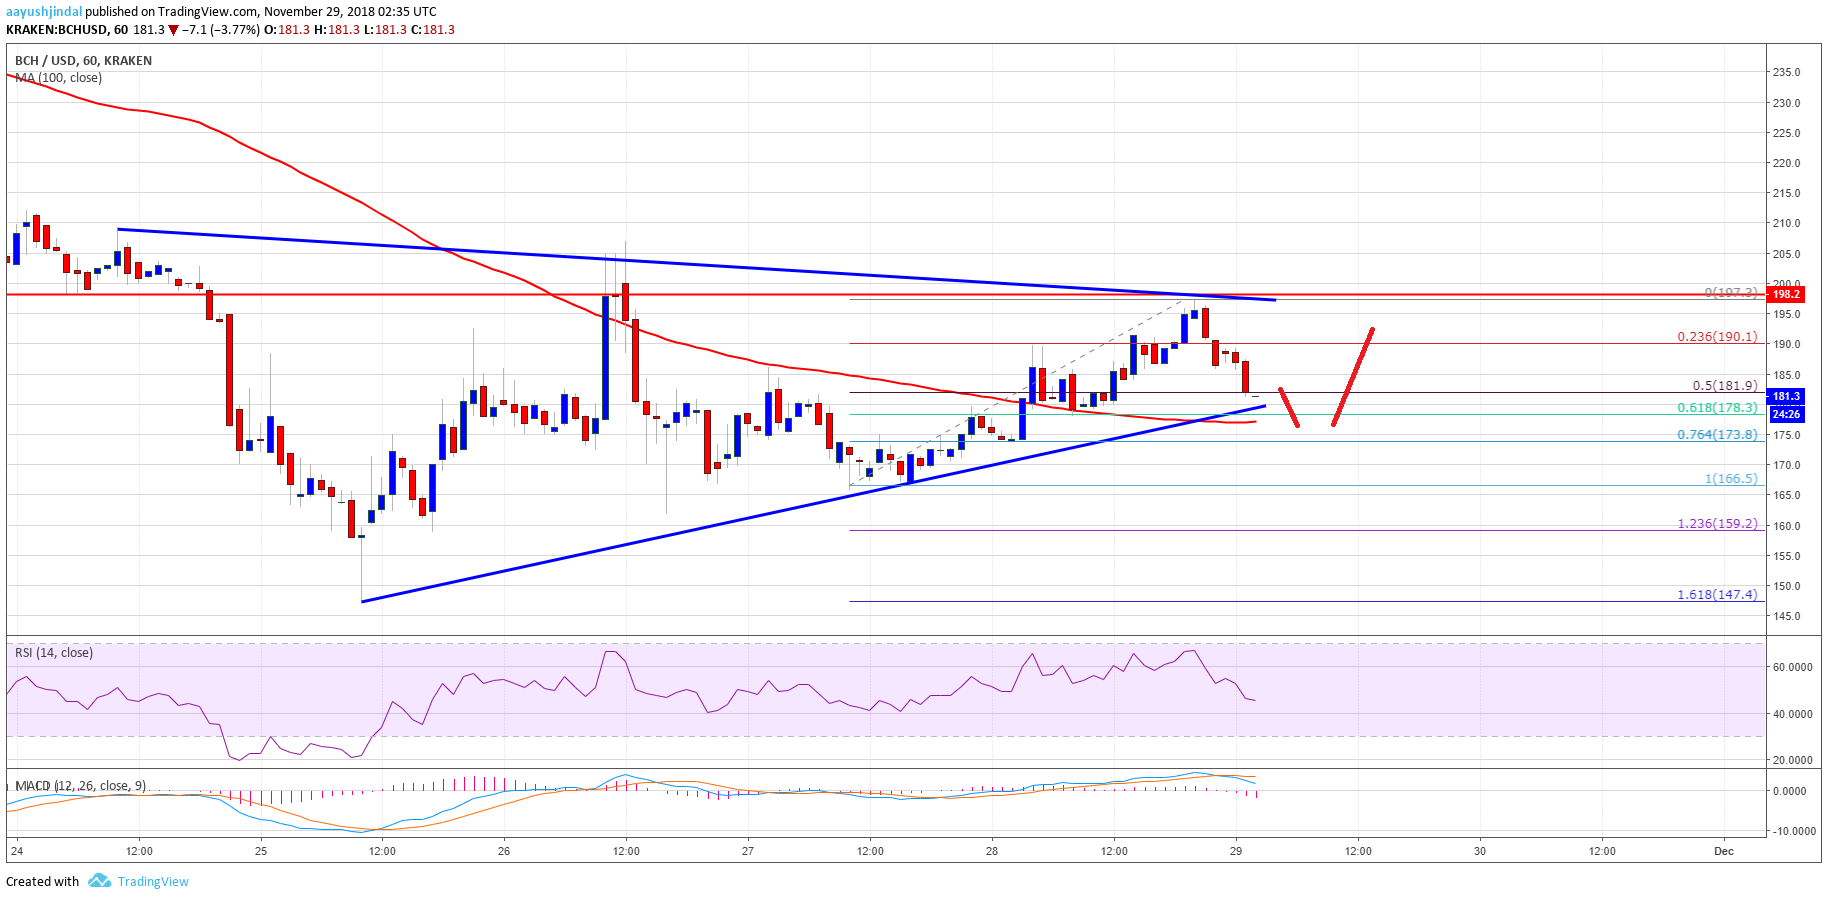
Looking at the chart, BCH price seems to be preparing for the next move either above 8 or below 5. Below 5, the price could revisit 5. And, a break above 0 may spark more gains towards 5.
Looking at the technical indicators:
Hourly MACD – The MACD for BCH/USD has moved back in the bearish zone.
Hourly RSI (Relative Strength Index) – The RSI for BCH/USD also declined below the 50 level.
Major Support Level – 5
Major Resistance Level – 8
The post Bitcoin Cash Price Analysis: BCH/USD Approaching Next Break appeared first on NewsBTC.