Key Highlights
- ETH price failed to move above the 5 and 6 levels against the US Dollar.
- There is a new key bearish trend line formed with resistance at 7 on the hourly chart of ETH/USD (data feed via Kraken).
- The pair is currently under pressure and it could accelerate declines below the 0 level.
Ethereum price is faced a fresh round of selling against the US Dollar and bitcoin. ETH/USD broke the 0 low and it could accelerate further losses.
Ethereum Price Analysis
Yesterday, we saw a minor upside correction in ETH price from the 2 support against the US Dollar. The ETH/USD pair corrected above the 0 and 2 levels. The price also moved above the 50% Fib retracement level of the last slide from the 5 high to 1 swing low. However, the upside, move was capped by the 5 an 6 resistance levels.
Buyers also failed to break the 61.8% Fib retracement level of the last slide from the 5 high to 1 swing low. Moreover, there is a new key bearish trend line formed with resistance at 7 on the hourly chart of ETH/USD. Clearly, the pair failed to gain momentum above the 6 level and declined. The recent downside move was such that the price broke the 4 and 2 support levels. More importantly, the price traded to fresh yearly low below 0. It seems like sellers are back and they could push the price further lower towards the 5 or 0 levels in the near term.
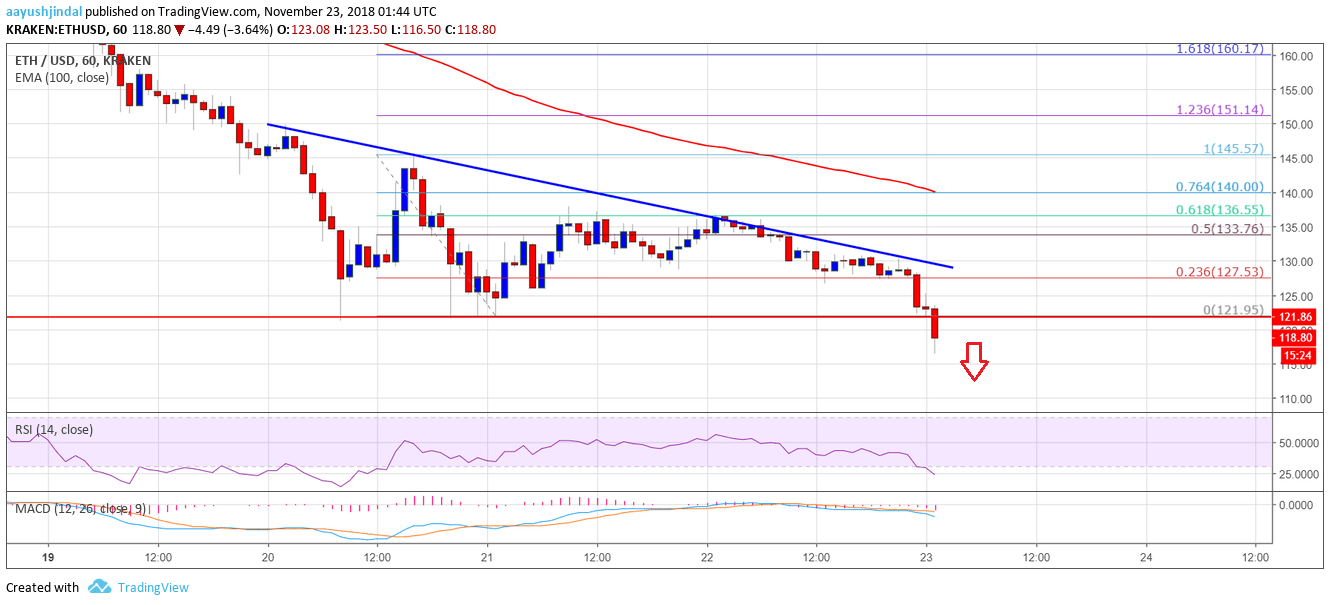
Looking at the chart, ETH price likely completed a short term correction from the 2 support. It failed to gain pace above key resistances near 6 and 0, resulting in a fresh decline. Buyers need to be careful considering the current market sentiment and break below 0.
Hourly MACD – The MACD is now back in the bearish zone.
Hourly RSI – The RSI is currently moving lower towards the 20 level.
Major Support Level – 0
Major Resistance Level – 0
The post Ethereum Price Analysis: ETH/USD Extending Declines Below 0 appeared first on NewsBTC.