Key Highlights
- ETH price failed to recover and declined below the 0 level declined against the US Dollar.
- There is a short term bearish trend line in place with resistance at 0 on the hourly chart of ETH/USD (data feed via Kraken).
- The pair traded to multi month low and it could continue to move down below 0.
Ethereum price fell sharply against the US Dollar and bitcoin. ETH/USD broke the 0 support and it is currently consolidating losses.
Ethereum Price Analysis
Yesterday, we saw a major decline below 5 in ETH price against the US Dollar. The ETH/USD pair broke the 9 and 5 support levels to start a fresh decline. Later, bitcoin price declined heavily and broke the ,000 support. It increased bearish pressure on ETH and pushed it below the 5 and 0 support levels. More importantly, there was a break below 0 and the price settled below 100 hourly simple moving average.
A new multi month low was formed at 2 and later the price started consolidating losses. It recovered a few points above the 5, but there are many hurdles on the upside. An initial resistance is the 23.6% Fib retracement level of the recent decline from the 9 high to 2 low. Moreover, there is a short term bearish trend line in place with resistance at 0 on the hourly chart of ETH/USD. If there is a break above the 0 and 1 level, the price could correct towards 0. It represents the 50% Fib retracement level of the recent decline from the 9 high to 2 low.
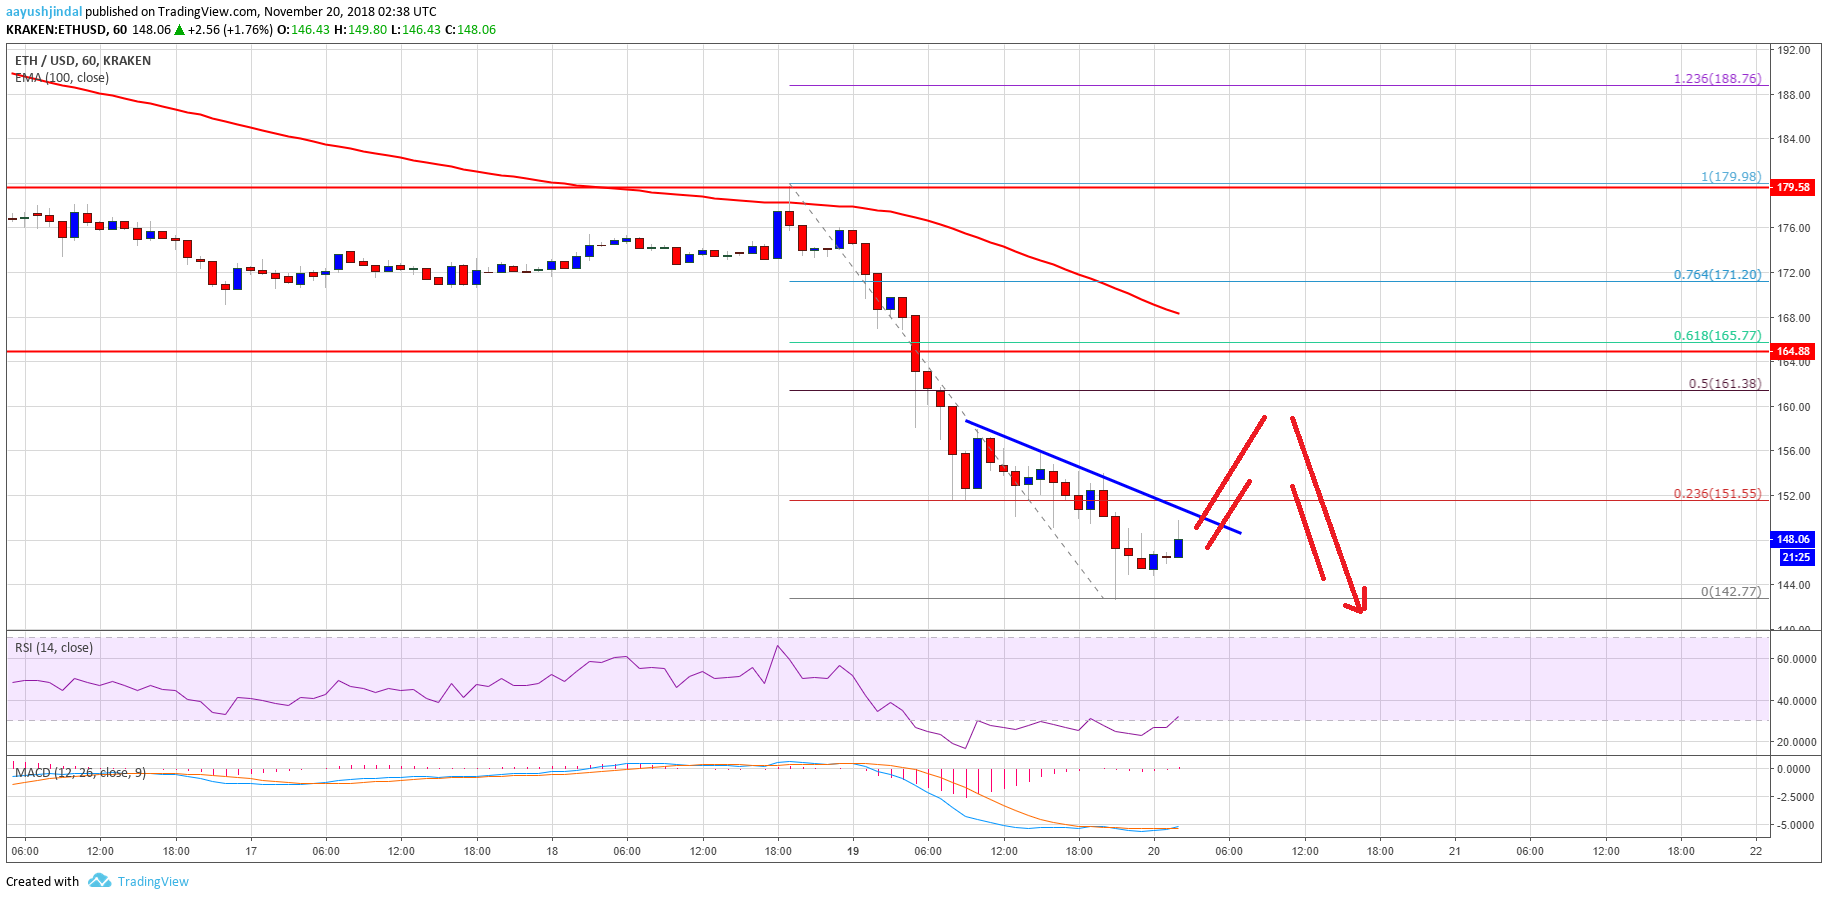
Looking at the chart, ETH price is trading in a nasty downtrend and it could decline further below the 2 low. The next major support is near 0, below which the price could trade to 5.
Hourly MACD – The MACD is slowly moving back in the bullish zone.
Hourly RSI – The RSI is currently attempting a recovery from the oversold area.
Major Support Level – 0
Major Resistance Level – 0
The post Ethereum Price Analysis: ETH/USD Nosedives Below 0 Support appeared first on NewsBTC.