Key Highlights
- Ethereum classic price tumbled recently below the .00 and .00 supports against the US dollar.
- There is a short term bearish trend line formed with resistance at .00 on the hourly chart of the ETC/USD pair (Data feed via Kraken).
- The pair is likely to extend the current decline towards the .20 and .00 support levels.
Ethereum classic price fell significantly against the US Dollar and Bitcoin. ETC/USD could continue to move down below .50 to test .00.
Ethereum Classic Price Analysis
After dropping to the .00 level, ETC price started a short term consolidation against the US dollar. The ETC/USD pair corrected a few points above .20, but it failed to gain traction. The price was rejected near the .50 level and the 100 hourly simple moving average. As a result, there was a sharp decline and the price traded below the .00 and .90 support levels.
It traded as low as .92 before correcting once again. It tested the 23.6% Fib retracement level of the recent drop from the .56 high to .92 low. However, upsides were capped once again near .30 and the price declined. It broke the .92 low and traded to a new yearly low. The current price action is super bearish below .00 and it seems like the price could accelerate below the .80 and .50 levels in the near term. On the upside, there is decent resistance formed near .90. Moreover, there is a short term bearish trend line formed with resistance at .00 on the hourly chart of the ETC/USD pair.
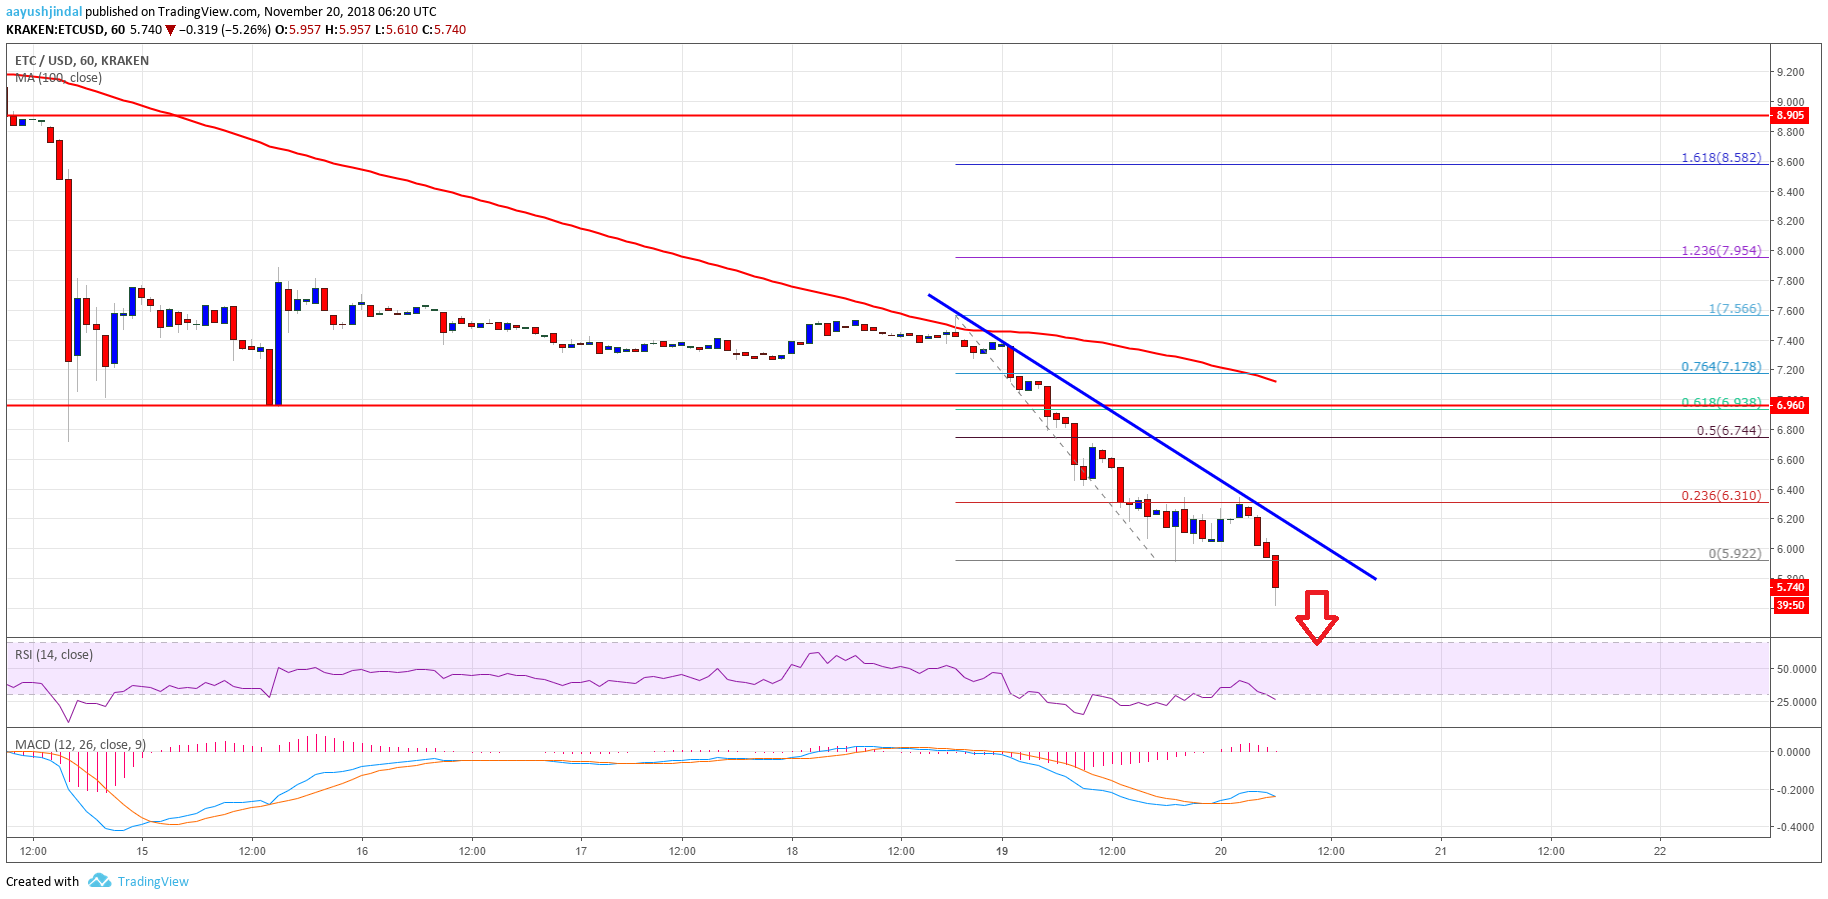
The chart suggests that ETC price remains at a risk of a downside extension below .50. If sellers remain in action, the next stop for them could be .20 or even .00. On the upside, resistances are at .00 and .75.
Hourly MACD – The MACD for ETC/USD is about to move back in the bearish zone.
Hourly RSI – The RSI for ETC/USD is well below the 30 level.
Major Support Level – .50
Major Resistance Level – .00
The post Ethereum Classic Price Analysis: ETC/USD Sellers Next Target .00 appeared first on NewsBTC.