Ethereum price is recovering losses above ,220. ETH could gain bullish momentum if there is a clear move above the ,285 resistance zone.
- Ethereum started a fresh increase above the ,180 and ,200 levels.
- The price is trading above ,220 and the 100-hourly Simple Moving Average.
- There was a break above a major declining channel with resistance near ,215 on the hourly chart of ETH/USD (data feed via Kraken).
- The pair could start a strong increase if there is a close above ,285 and ,300.
Ethereum Price Regains Strength
Ethereum price remained supported above the ,100 zone. ETH formed a base and was able to start a recovery wave above the ,150 resistance zone, like Bitcoin.
There was a decent increase above the ,180 resistance zone. Besides, there was a break above a major declining channel with resistance near ,215 on the hourly chart of ETH/USD. The pair cleared the 61.8% Fib retracement level of the downward move from the ,378 swing high to the ,980 low.
Ethereum is now trading above ,220 and the 100-hourly Simple Moving Average. On the upside, the price is facing resistance near the ,285 level. It is close to the 76.4% Fib retracement level of the downward move from the ,378 swing high to the ,980 low.
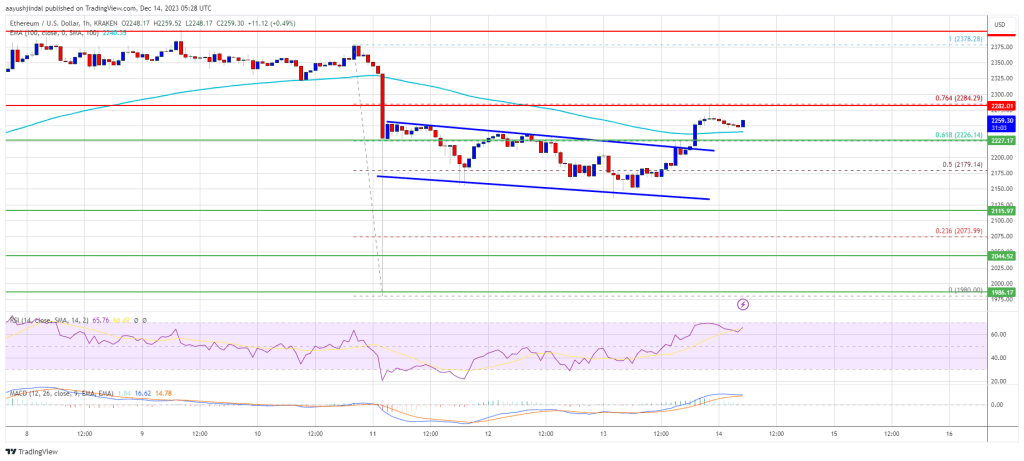
Source: ETHUSD on TradingView.com
The next key resistance is near the ,350 level. The main resistance is now near ,400. A clear move above the ,400 zone could send the price toward the ,500 level. The next resistance sits at ,580. Any more gains could start a wave toward the ,640 level.
Another Decline in ETH?
If Ethereum fails to clear the ,285 resistance, it could start a fresh decline. Initial support on the downside is near the ,230 level or the 100-hourly Simple Moving Average.
The next key support is ,180. The main support is now near ,120. A downside break below ,120 might start another major decline. In the stated case, Ether could revisit the ,000 support. Any more losses might call for a test of the ,880 support zone in the near term.
Technical Indicators
Hourly MACD – The MACD for ETH/USD is gaining momentum in the bullish zone.
Hourly RSI – The RSI for ETH/USD is now above the 50 level.
Major Support Level – ,230
Major Resistance Level – ,285