Key Points
- Bitcoin cash price declined heavily and traded below the 0 and 0 levels against the US Dollar.
- Yesterday’s highlighted key bearish trend line is intact with resistance at 5 on the hourly chart of the BCH/USD pair (data feed from Kraken).
- The pair is currently trading near the 0 level and it could decline further towards 0.
Bitcoin cash price is under heavy selling pressure against the US Dollar. BCH/USD could continue to move down and it may test the 0 level in the near term.
Bitcoin Cash Price Analysis
Yesterday, we discussed how there was an increase in selling pressure below 0 in bitcoin cash price against the US Dollar. The BCH/USD pair declined heavily and broke the 0 and 0 support levels. It is now trading well below the 0 level and the 100 hourly simple moving average. The recent decline was such that the price even broke the 0-255 support area and formed a low at 9.
At the moment, the price is consolidating losses near 0 with bearish moves. An initial resistance is the 23.6% Fib retracement level of the recent decline from the 9 high to 9 low. Above 0, the price could test the 0 level, which is a major resistance. More importantly, yesterday’s highlighted key bearish trend line is intact with resistance at 5 on the hourly chart of the BCH/USD pair. The trend line coincides with the 50% Fib retracement level of the recent decline from the 9 high to 9 low.
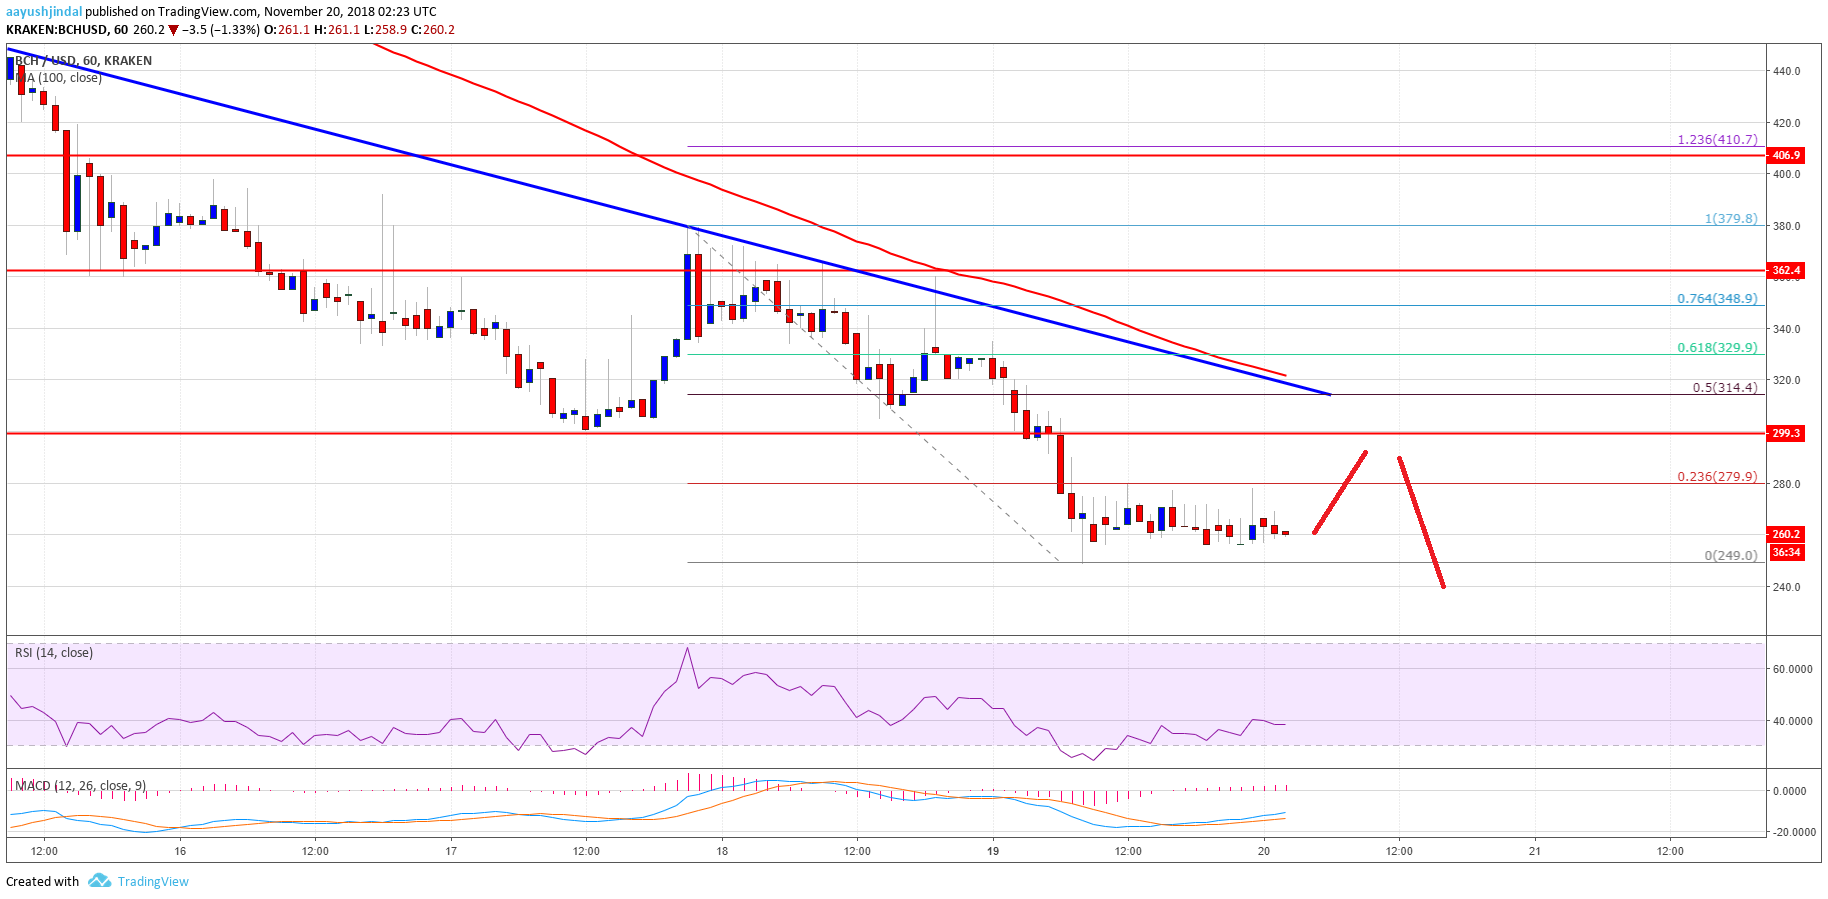
Looking at the chart, BCH price is clearly in a major downtrend below 0 and 0. There could be a minor recovery, but later the price is likely to resume decline. The next main support for buyers is near 0 followed by 0.
Looking at the technical indicators:
Hourly MACD – The MACD for BCH/USD is slightly placed in the bullish zone.
Hourly RSI (Relative Strength Index) – The RSI for BCH/USD is currently near the 40 level.
Major Support Level – 0
Major Resistance Level – 0
The post Bitcoin Cash Price Analysis: BCH/USD Tumbles, 0 Next? appeared first on NewsBTC.